The Hotels Network (THN) is a leader in the conversion of optimization and personalization for hotel booking websites. They segment visitors to their customers' websites in real time by assigning them a score based on hundreds of variables, both historic and present. THN sends these as events to Tinybird, where we process, compute and expose them as API endpoints, so they can personalize each user’s browsing experience in real time.
Right now, THN makes on average over 120 requests per second to Tinybird API endpoints for browsing personalisation. With such high writing and reading requirements, we wanted to optimize their performance. The areas we chose to focus on were:
- Mitigating disk pressure caused by constantly writing new parts and merging them
- Minimizing the amount of read data in each API endpoint call
- Reducing the number of parts accessed
- Designing the data model to retrieve data from a single user as fast as possible.
Reducing the execution time
First, we released a simplified version of the API endpoint to all THN’s website traffic. This meant we could expose a small amount of traffic and A/B test the different optimizations.
Our focus was to reduce execution time. The initial version was around 340 ms, taking into account 150 queries per second (QPS), so we can estimate an upper boundary of 50 cores just to be able to serve the data.
Using the right partitions
Next, we distributed data across partitions. We decided to partition the table using the key that identifies the user (a fingerprint or uuid), applying a modulo function to split it in 50. This way, every query asking for data for a single user will attack a single partition.
Queries were successfully reading fewer files but we discovered a major issue with this approach. Every single write operation was generating parts for each partition, causing major disk throttling due to the high amount of IOPS, and saturating Zookeeper when replicating data across the cluster.
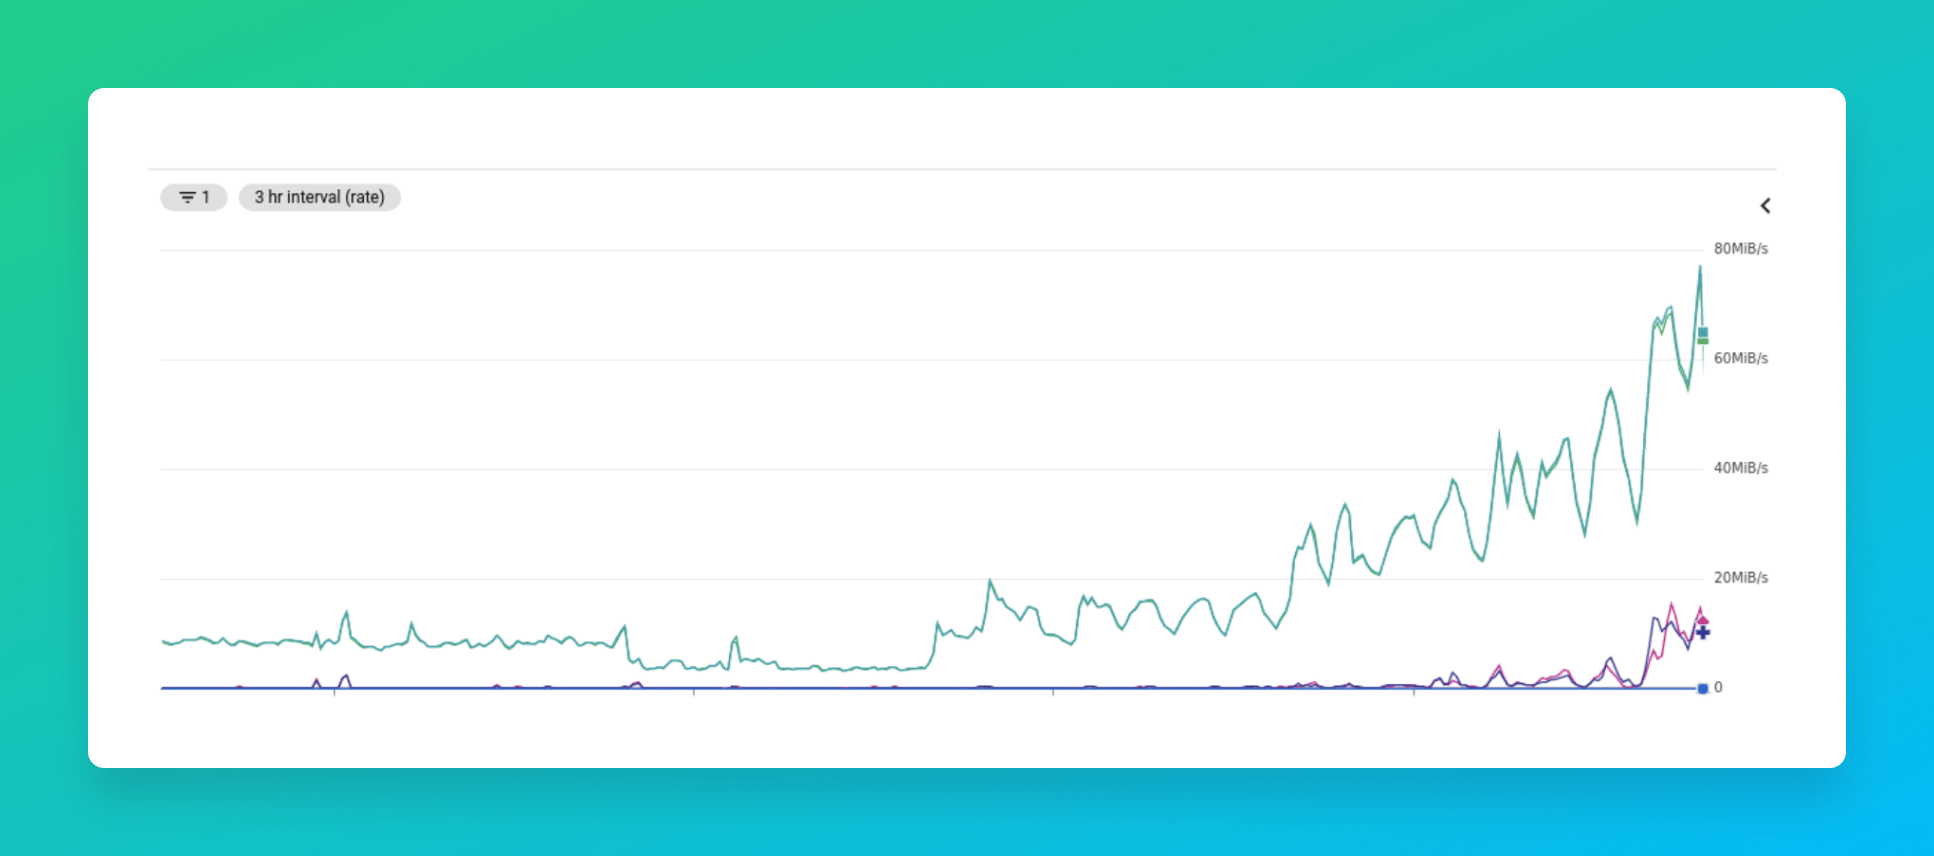
Even though this experiment failed, it was a good reminder that one of the main criteria for selecting how to partition is that each INSERT should write to a single partition. One of the key challenges of this project was to find out how to improve read time without affecting writing performance. We had to make some trade-offs. We went for partitioning by quarter with a time to live (TTL) that removes old data and prevents accumulating data and partitions.
Improving the data flow
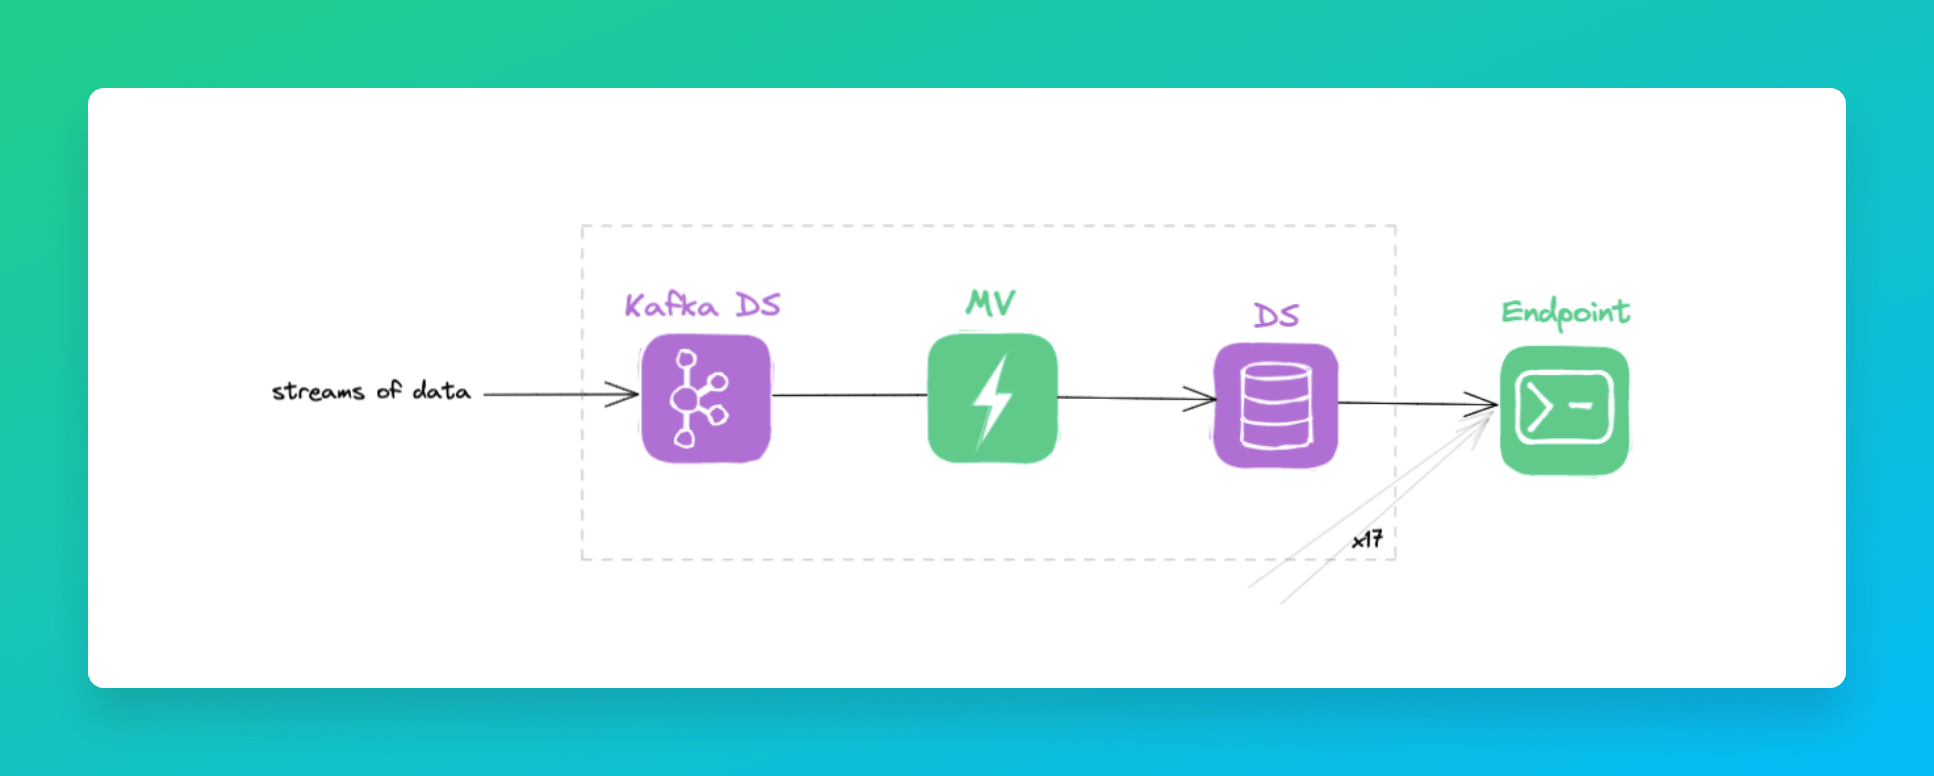
Another step to reduce query complexity was trying to reduce the number of tables the endpoint was reading. Initially, we had 17 different sources which were updated every few seconds, writing a lot of parts to disk.
The data flow looked like this: a data source received data from Kafka. The data was then materialized to the datasource used in the endpoint.
We managed to reduce the number of data sources to six, by grouping data sources using the same groupings and pointing materialized views to them.
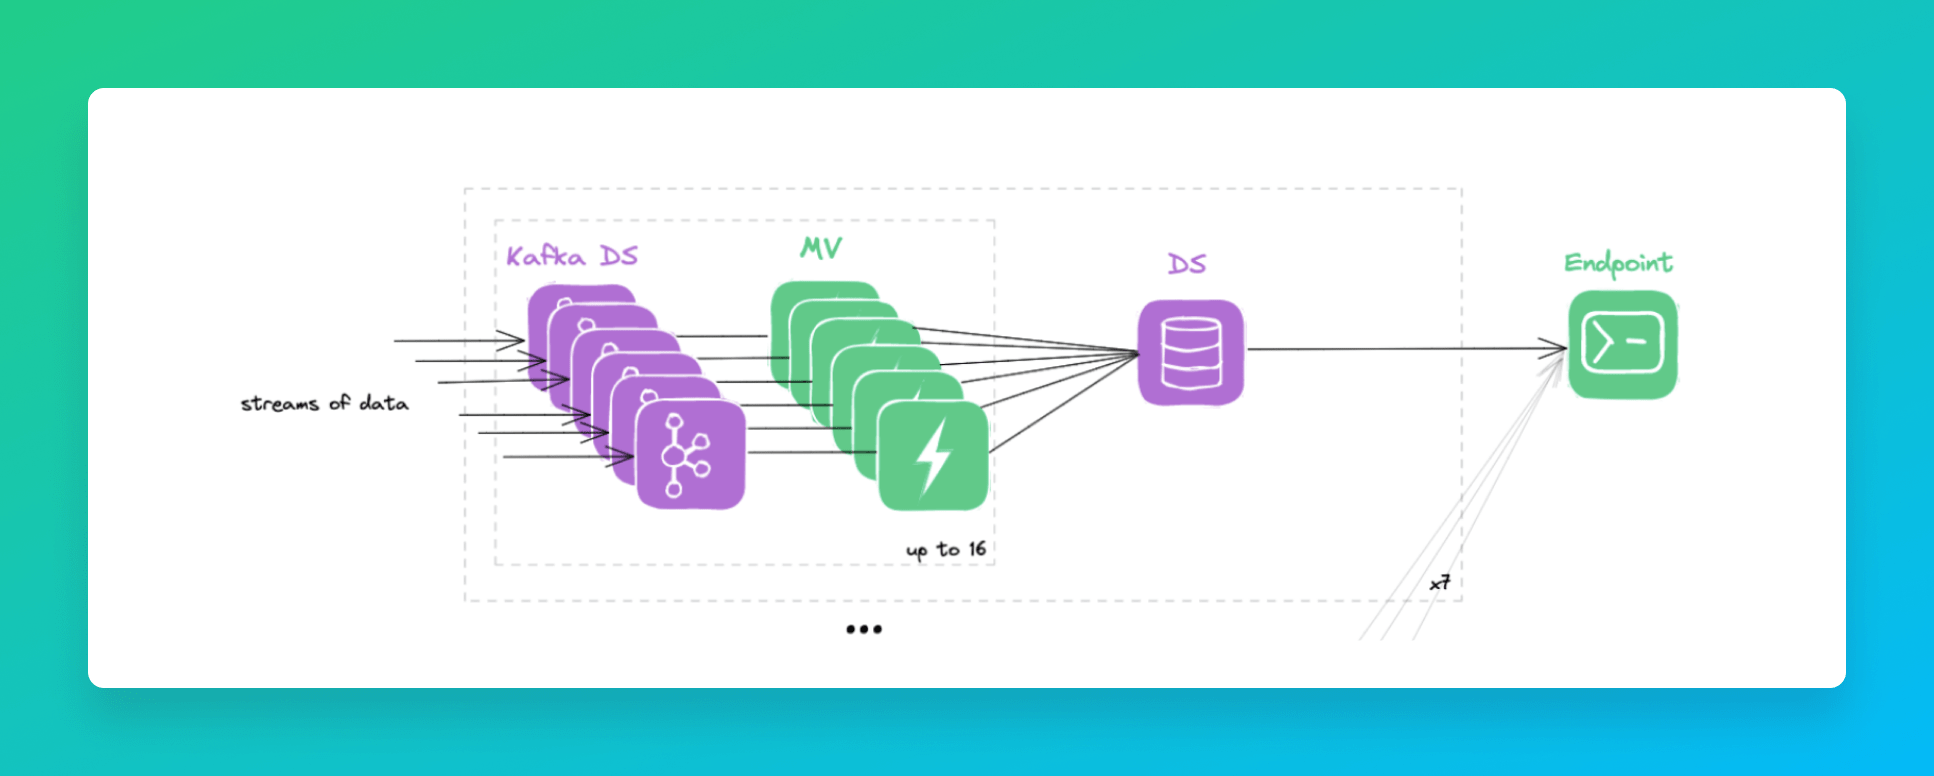
The problem with this approach is that the number of parts created by data sources increased considerably. In short, we were writing the same number of parts but instead of distributing them across 17 data sources, everything was condensed to six. Some data sources were receiving around 200 new parts per minute.
While endpoint complexity was reduced a lot, performance was more or less the same, since the number of parts being read was the same (if not more).
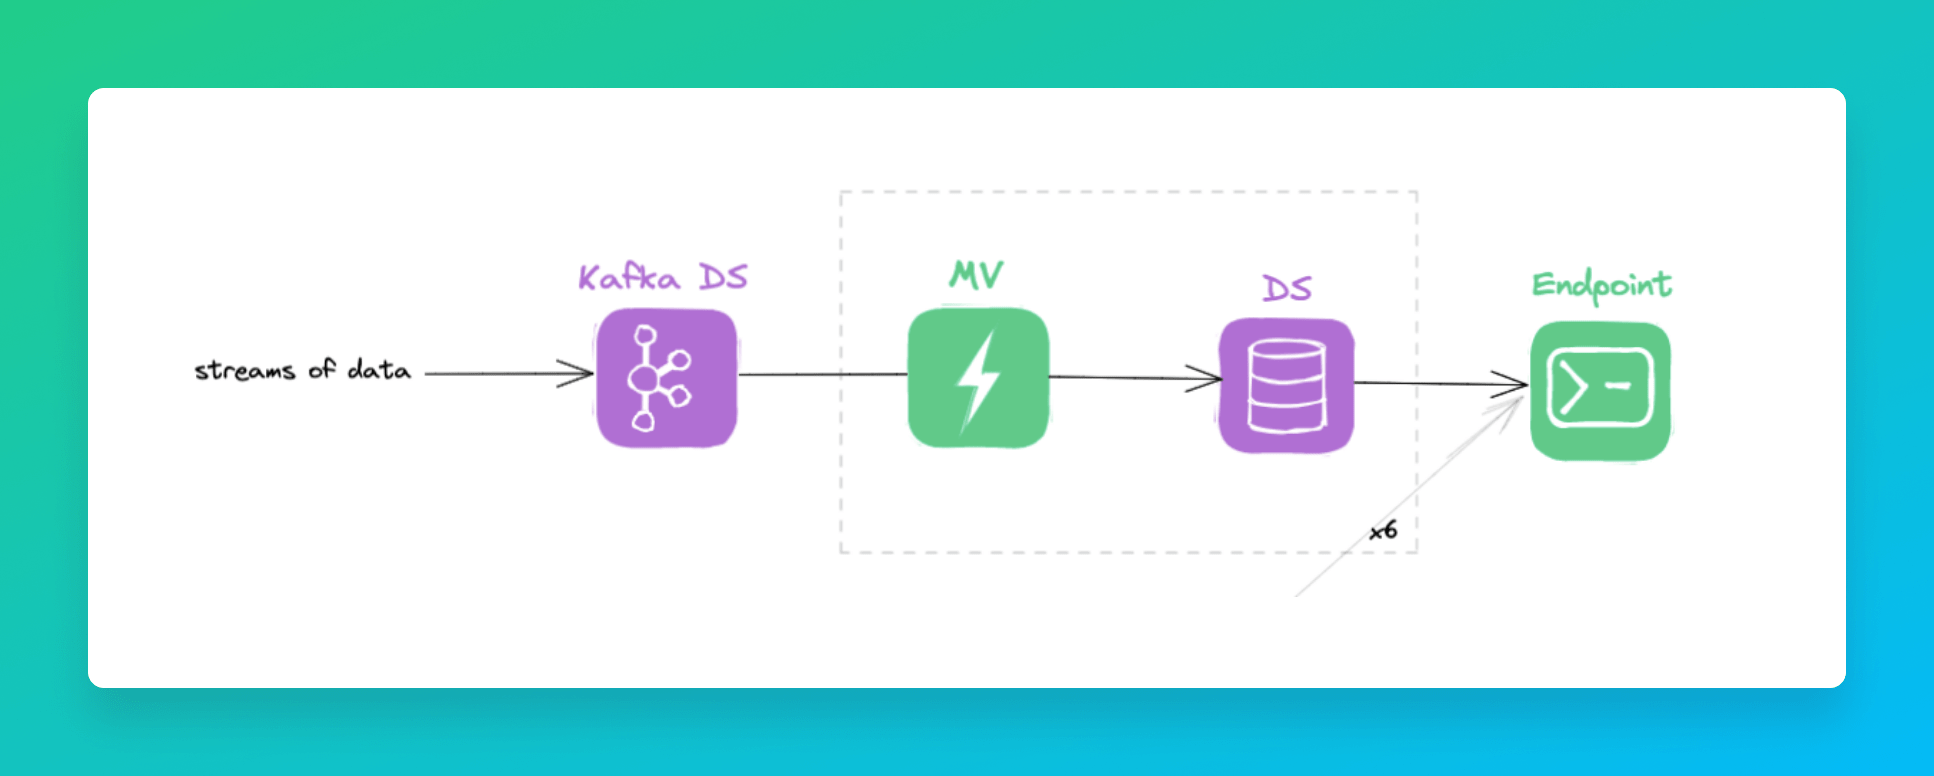
Finally, we managed to join all Kafka topics in one, being able to receive a single write per second per table. This reduced the number of new parts to 12 parts per minute per table. A more reasonable rate that allowed the merge parts algorithm to keep up.
Reduce the index granularity
Next, we tried setting up a smaller index granularity to reduce the amount of data being read by the endpoint. You can read more about index granularity and how it works here.
This optimization was easy to test; reducing the index granularity directly reduces the number of rows scanned in query time. But, reducing the index granularity also meant increasing primary index and markers file sizes. Those files have to be read and cached to perform a query. If the size is too big it makes other queries (e.g. SELECT * FROM table) painfully slow.
Also, at some point, reducing the index granularity didn’t improve query time. Maybe we were hitting another bottleneck.
Eventually we went for an index granularity that reduces the read rows without compromising other parts. Currently, this is 1024.
Going further
With these optimizations, we reduced the endpoint response time from 340 ms to 240 ms. But we wanted to continue iterating and improving.
The endpoint is executing a big query that is composed of different subqueries. But we also wanted to evaluate a slower subquery. The slower subquery was taking 42 ms, and after all the improvements it didn’t make much of a difference if it read 1 MB or 4 MB. The bottleneck had to be somewhere else, so we began to explore other ways of improving performance. After reducing the data read by changing the index granularity and forcing to merge parts, we were not observing any improvement in query performance.
Time to step back and invest some time understanding where the time was going. Aggregations? Returning too many columns? Reading data from disk?
Improving the query
After querying seven tables we have to join all the data. The original approach was to write different subqueries in Tinybird nodes, then joining the results using LEFT JOIN statements.
We tried removing the joins by using unions instead but we faced some performance issues from ClickHouse. The performance was 25% worse, so adding 100ms to the endpoint. This issue was reported upstream.
Then we thought that since the endpoint was joining seven single-row subqueries, a cross join could help here.
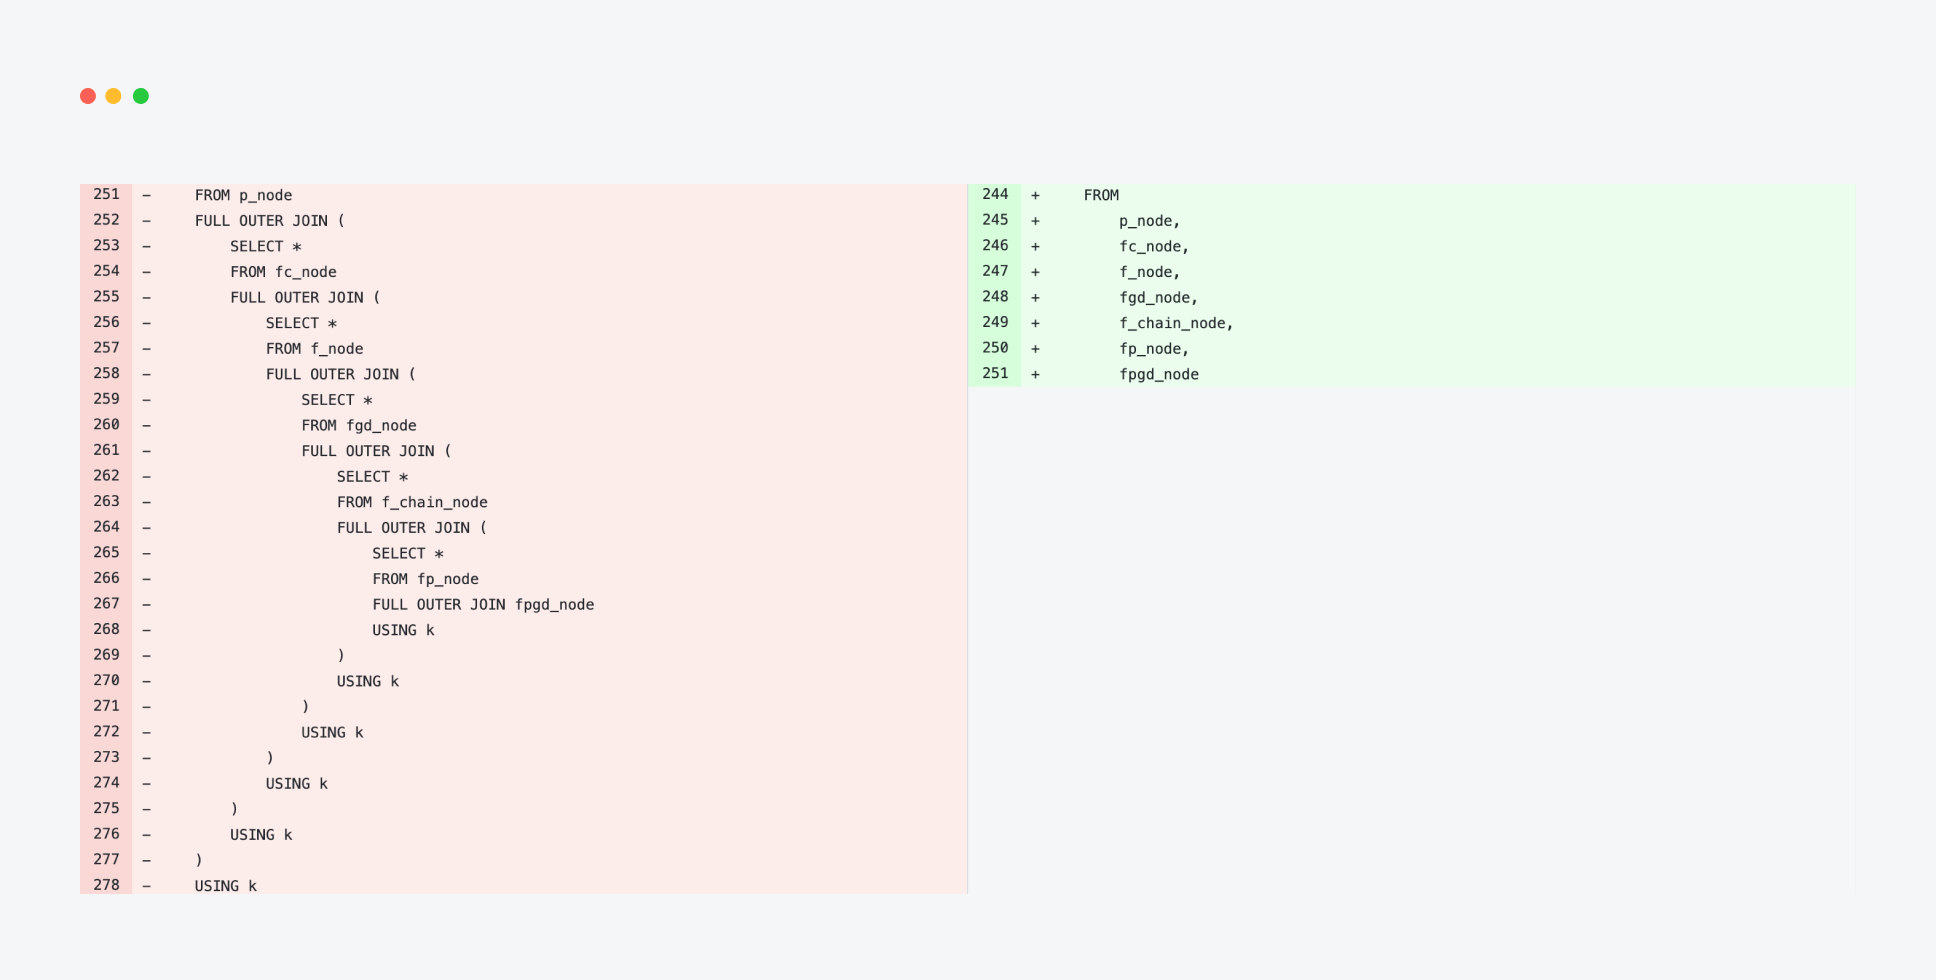
As often is the case, the easiest change comes with the biggest performance improvement. The endpoint performance went down from 240 ms to 170 ms, a 30% improvement just by changing the join method.
Forcing compact parts
Another hypothesis was that we were reading a massive number of columns, and ClickHouse being a columnar database, that means that each column is stored in a different part of the disk. We thought that having a way to read column values sequentially would improve performance. We had read about compact parts, and decided to give it a try. You can learn more here.
We were a bit discouraged because we’d seen some replies from Alexey Milovidov advising against forcing big compact parts:

So it looked like even using compact parts, the mechanism to access data would prevent ClickHouse from reading columns sequentially. However, the results looked promising...
We created a small proof of concept.
Changing from wide parts to compact parts, the performance improved from 62 req/s to 223 req/s for the small proof of concept.
Future work
As a last resort, we used a profiling tool called perf to collect and analyze performance and trace data. We didn’t find any low-hanging fruit improvements, but we did find possible improvements in our product that are now being addressed.
- In the wrapper that Tinybird adds to provide more flexibility to the endpoint queries, some operations were not strictly required and some fine tuning will give us a performance boost.
- We also tried reducing the number of parts. Query duration dropped from 0.015 to 0.012, which is a ~20% improvement. This confirmed our idea that we should keep pushing trying to reduce as much as possible the number of parts. Maybe tweaking the merge parts algorithm will help here.
- We also tried retrieving fewer columns but we didn't see any significant change. Query duration was reduced but the time spent in parsing the query vs. execution was the same.
Understanding how ClickHouse merges parts
To extract maximum performance with ClickHouse, it is really important to understand how it merges parts. Stay tuned for an upcoming blog post on the topic. In the interim, here is the upstream issue we created for more info.
Learn more about The Hotels Network from their customer story.

