Problems with data ingestion are common: some data may be missing, or maybe it is in the wrong format or has the wrong encoding… it happens. But we have learnt from our users that they do not want to invest valuable time trying to figure out what exactly went wrong and how to fix it.
You know, it is relatively easy to spot a typo on a written page, but until spellcheckers came along, doing it across a whole book was a daunting and arduous task. The same is true for huge datasets.
When an ingestion process fails due to a problem with specific rows, pinpointing what the exact problem was (or which specific row was the culprit) is usually pretty painful.
And not only that! In a production environment, you also want to be able to track all your ingestion jobs, figure out if they are getting faster or slower, or whether the error rate is increasing.
In short, you want to be in full control over your data ingestion and operations.
This is why we decided to develop the Data Operations log, a feature that will help you gain total visibility over any operation run against any of your Data Sources.
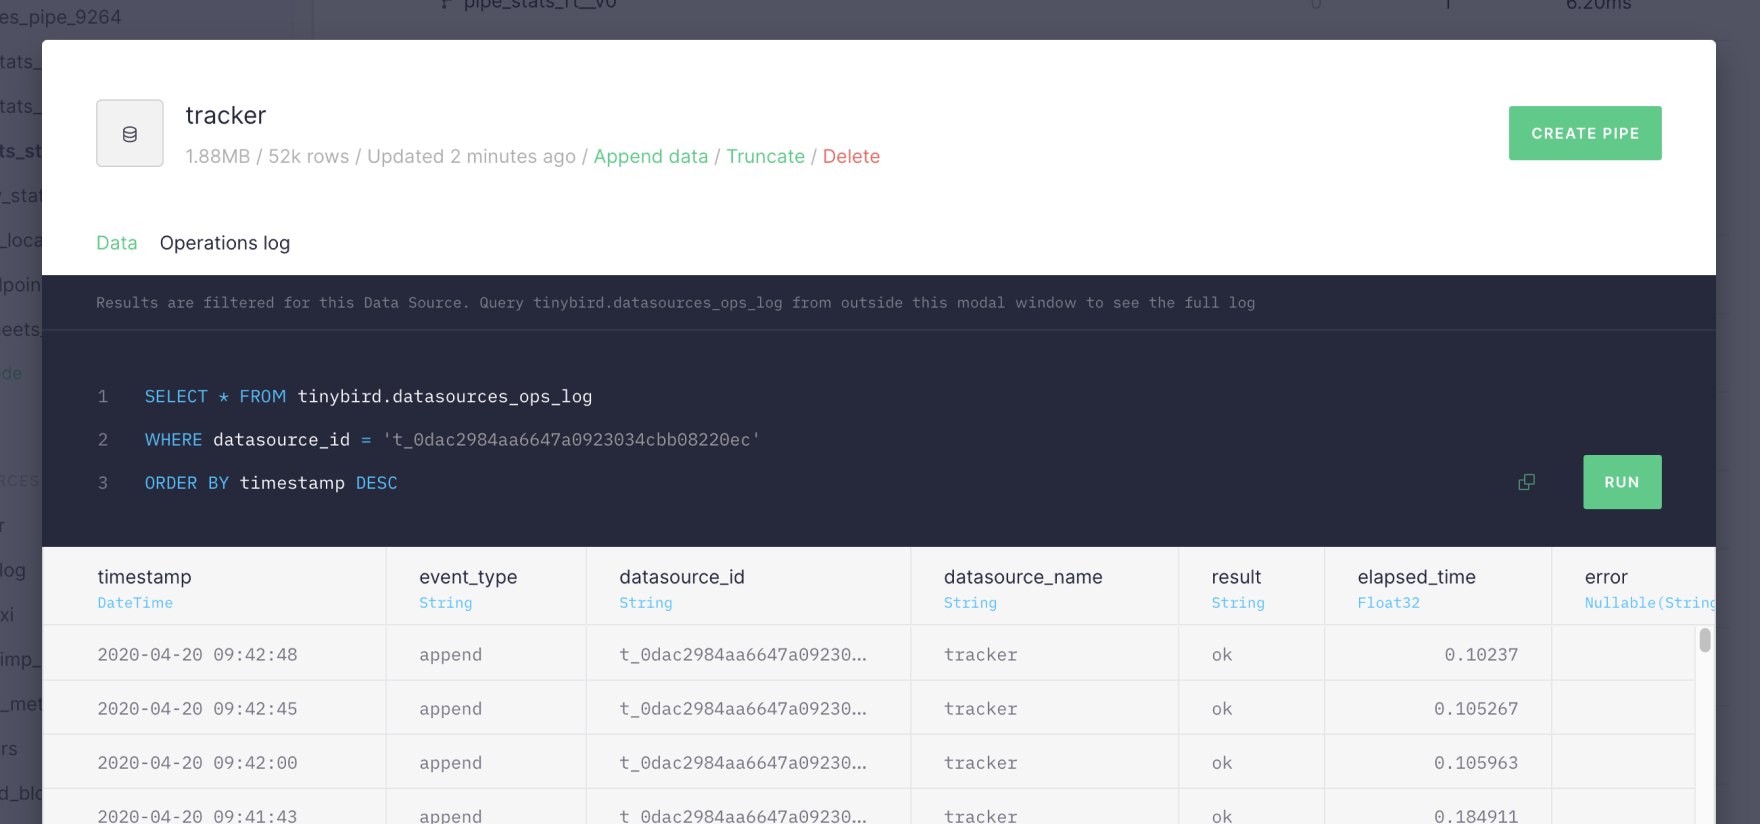
By accessing the Data Sources Operations Log, either from the UI or the Data Sources API, Tinybird users can get all the information related to every and each operation performed over any of their data sources: what was the operation in question, whether it was succesful, how long it took, how many rows were ingested and, in case of an error, learn more about what happened exactly.

As you can see, developers can find detailed information about Data Source creation, every single append operation, deletions, imports, renames, replacements, etc…, all by querying the log directly or by clicking on the Operations Log tab on the Data Source preview modal window. The log lists all information related with the different operations performed on your Data Sources including elapsed time.
Exposing the Data Source Operations Log as a service dataset will let our users query it directly through the API by creating a Pipe, or develop more advanced things like alert systems, and ad-hoc reporting tools.
Check out the example below to see how you can list the last operations in the Data Source Operations Log.
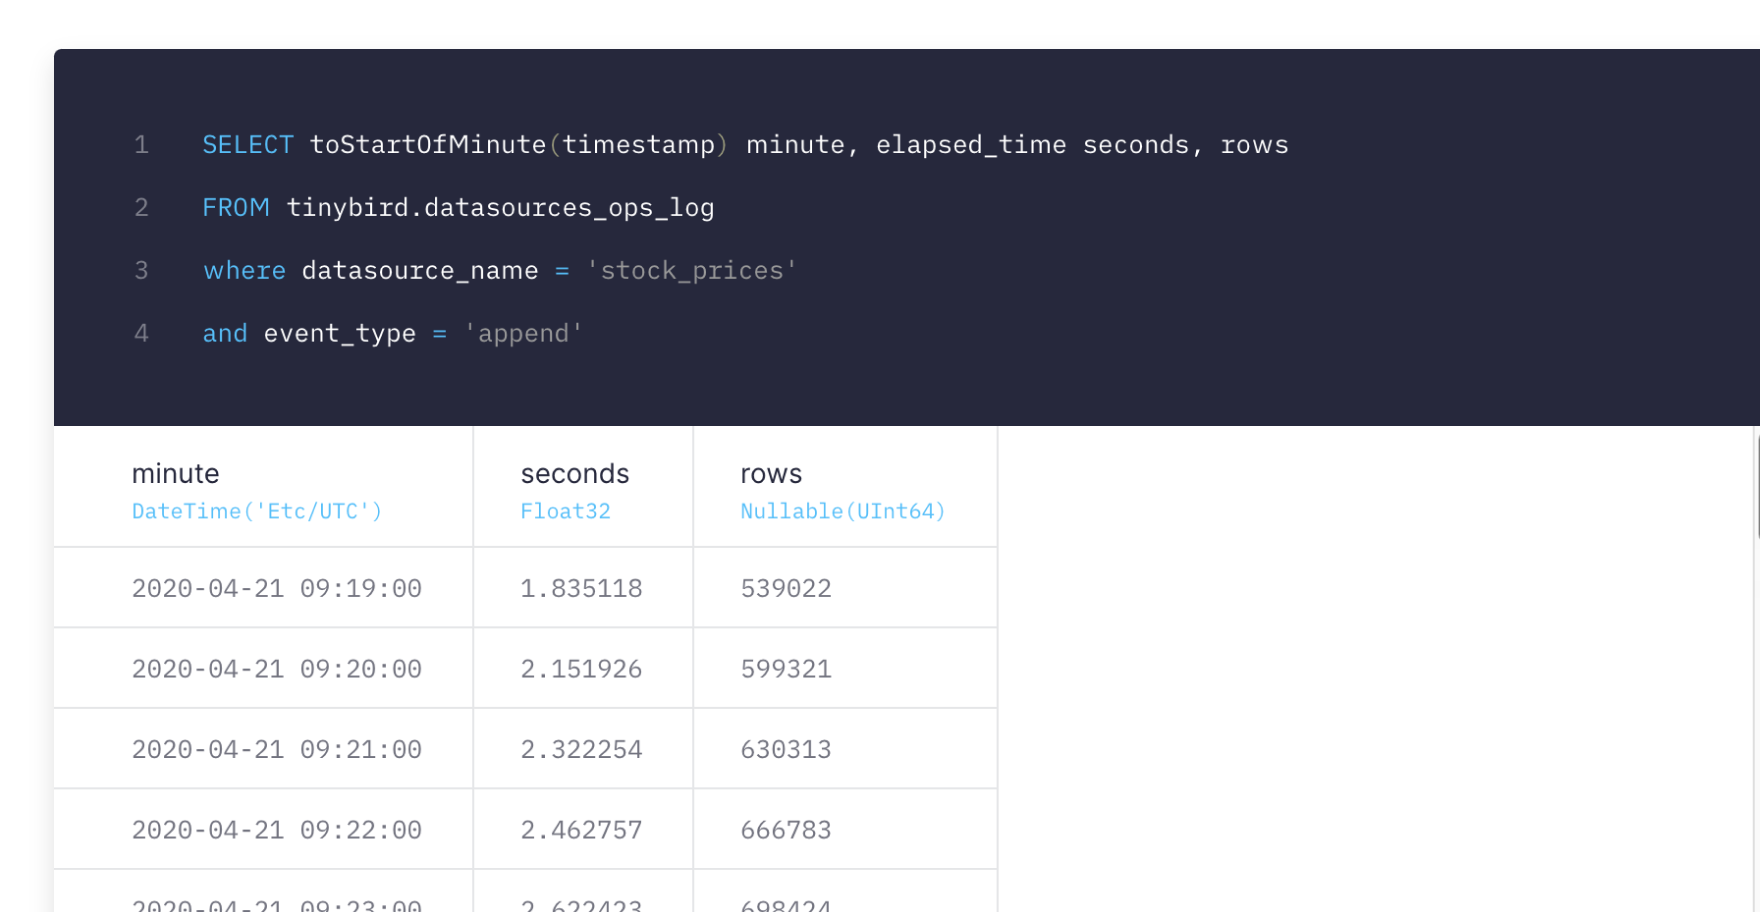
or how to aggregate operations by type and date:
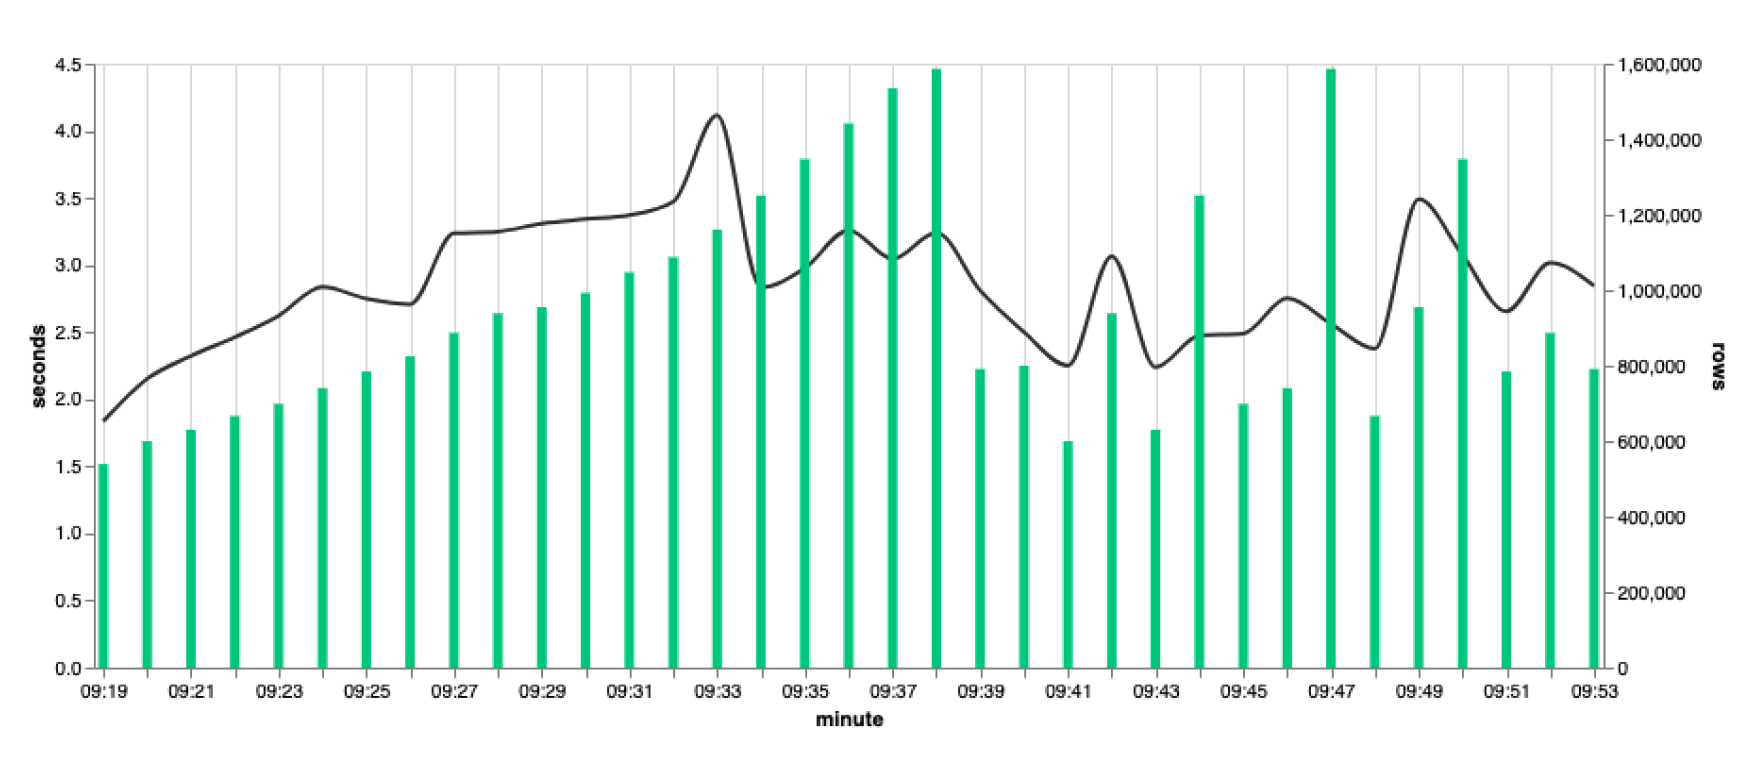
And let’s say you wanted to visualise the elapsed time of your imports for a particular data source against the number of rows ingested each time. You could create an endpoint like this one:

And the chart in Vega would like the following:

We have been using this internally for a few weeks already and we love it! If you are interested in building rock-solid Analytical solutions quickly and with full control, request accest to your Tinybird account now

