If you’re looking for open source alternatives to Google Analytics, you might be considering some SaaS products like Plausible, Fathom, or Matomo.
These can be great options for non-technical folks who want a privacy-first Google Analytics alternative.
But, if you want more flexibility, control, and performance than a typical SaaS can offer, you might consider an open source Google Analytics alternative that you can easily extend. It’s not nearly as hard as it seems.
In this blog post, I’ll explain how to build a functional Google Analytics alternative using an open source Starter Kit from Tinybird, so you can track website traffic without using Google Analytics.
Then, once you’ve got the basic dashboard in place, I’ll also show you how to customize it to get precisely what you want out of a DIY Google Analytics alternative.
To get started with this open source Google Analytics alternative, just follow the steps below. Let’s get started.
Step 1: Create a new Tinybird workspace
Tinybird is the analytical backend that will power your DIY Google Analytics alternative. To build this basic web analytics dashboard, you’ll be using the Tinybird Web Analytics Starter Kit. If you have experience with Tinybird and just want to get your dashboard set up ASAP, then you can follow the steps on the Starter Kit page (just click the button below).

If you’re just getting started with Tinybird, then I recommend that you follow these steps.
First, navigate to app.tinybird.co to get started and log in. Sign up for a free Tinybird account if you haven’t already.
Select your region
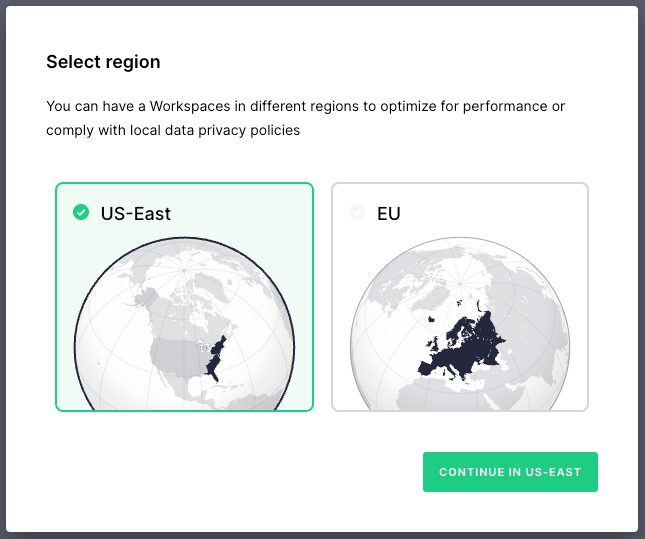
You can set up Tinybird workspaces in different regions to optimize for performance and comply with local data privacy laws. You’ll be prompted to select a region when you log in. Choose the region you need for your application.
Create a new Workspace
The next step is to create your Tinybird Workspace, which is basically a collection of Data Sources, Pipes, and Endpoints for your project. I’ll explain what those are later, but feel free also to check out the Tinybird Guides or Docs if you want to deep dive into how Tinybird works.
If this is your first Tinybird Workspace, you’ll be prompted to create a new one after you log in and select your region.
Give your Workspace a descriptive name, and choose the “Web Analytics” Starter Kit. Then click “Create Workspace.”
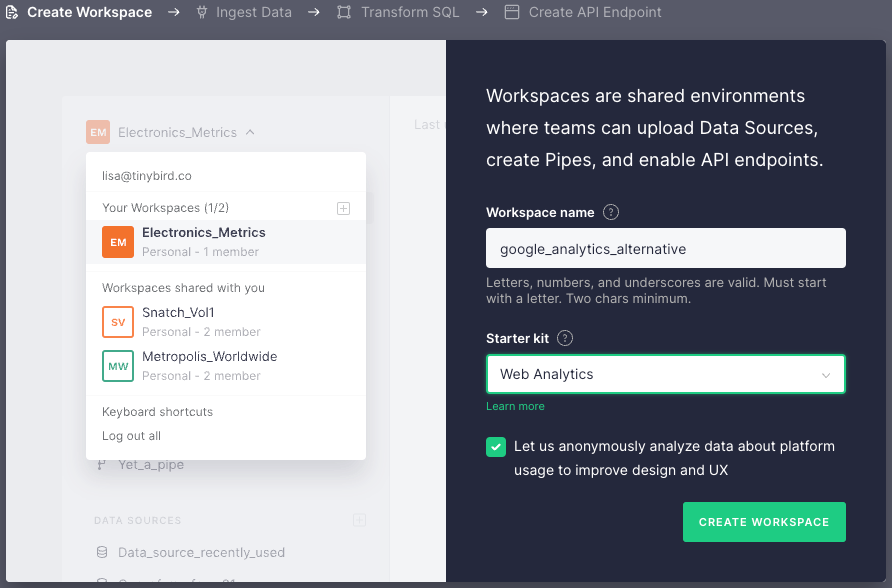
By deploying a Starter Kit, your Workspace will come with pre-deployed all the Data Sources, Pipes, and Endpoints you need to get started. After you’ve set up the basic dashboard, I’ll go into more detail on what’s happening under the hood and how to customize..
In the Workspace you just created, you’ll see an analytics_events Data Source. This is where the JavaScript tracker we install in the next step will send events data like pageviews from your website. If you click on that Data Source, you can see that it currently has no data in it.
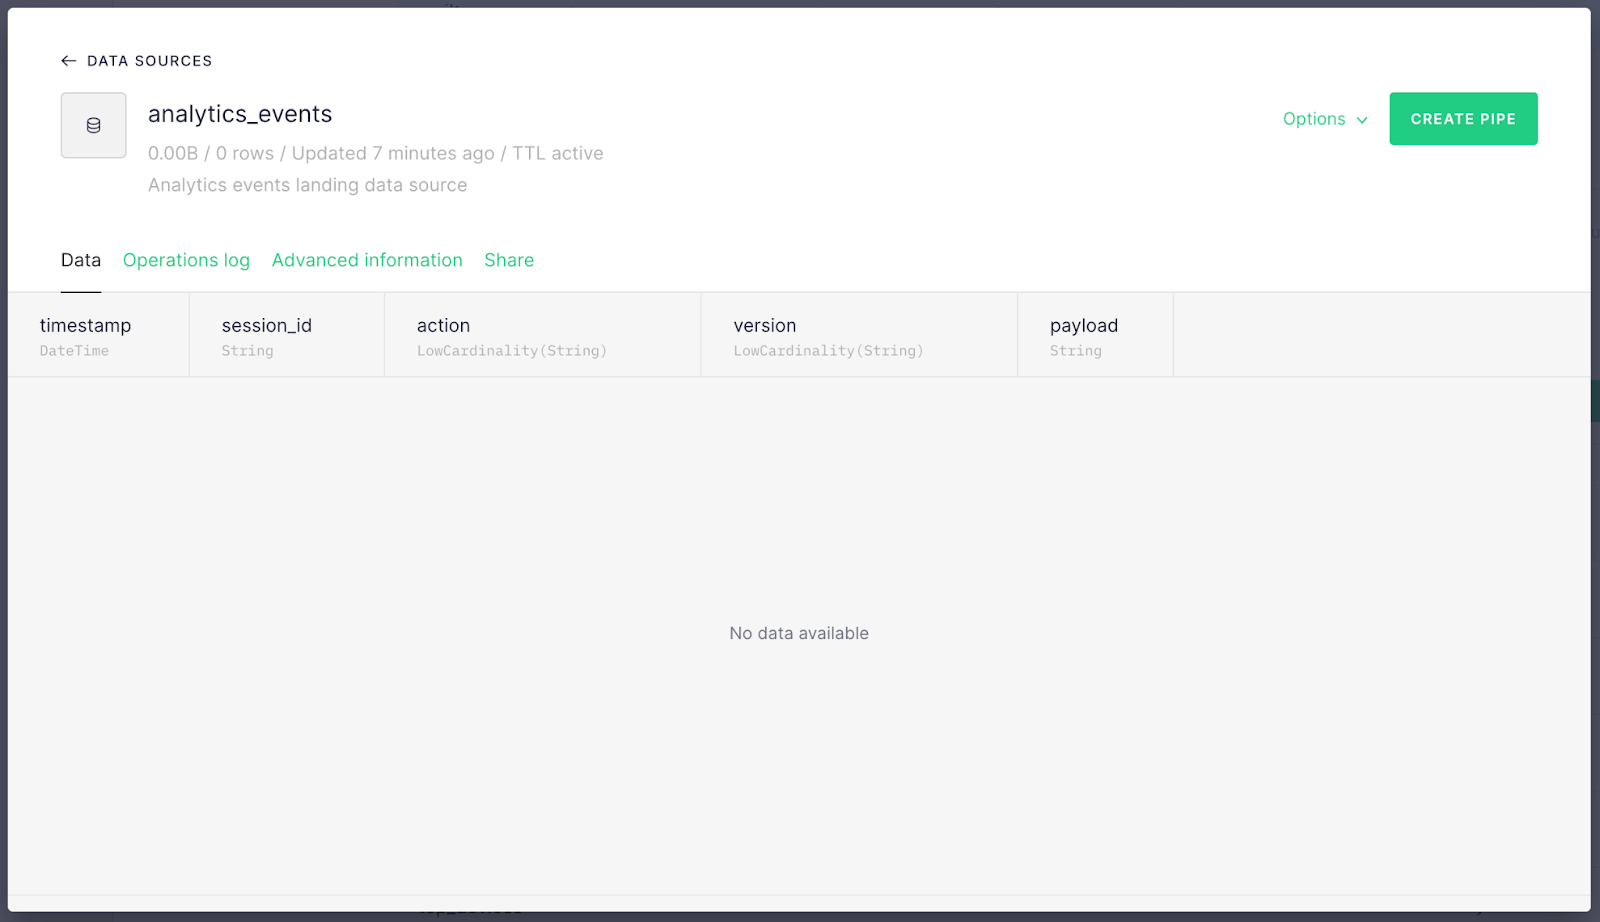
Now let’s start sending data to your Tinybird Data Source! To do that, you need to install the tracking snippet on your website.
Step 2: Install the tracking code on your website
Next, we’ll install the JavaScript snippet in the <head> tag of our website. This snippet will capture basic page_hit (pageview) events and send them to the analytics_events Data Source.
Copy the snippet
When you created the Workspace from the Starter Kit in Step 1, you’ll see this banner in the UI:

Click “Copy snippet” to copy your customized tracking code.
Paste it in your website <head> tag
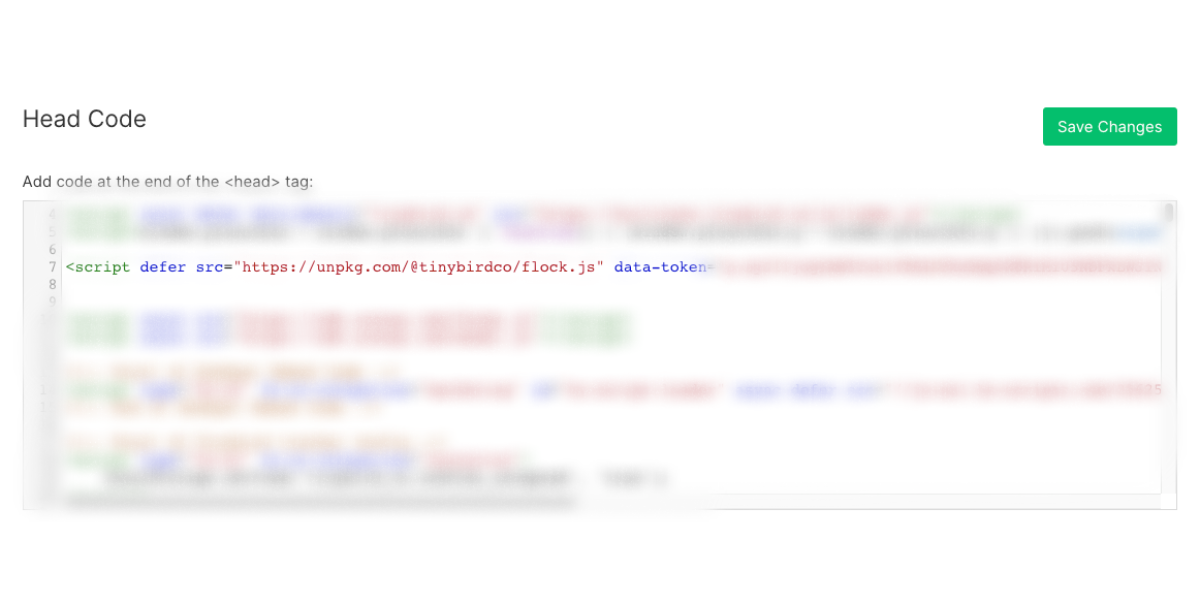
Once you’ve copied the snippet, you’ll need to paste it in the <head> tag of every page on your website that you want to track.
If you’re using a CMS, there’s usually a place to paste the snippet just once and have it appear in every page's <head> tag. Here’s an example in the Webflow CMS:
A note about tokens
You’ll notice the tracking script includes a data-token attribute. Tinybird uses auth tokens to define permission scopes for interacting with Data Sources, Pipes, and Endpoints.
The tracking code you just pasted on your website uses a tracker token defined in the Tinybird Workspace you created in Step 1. This tracker token has “append” permission for the analytics_events Data Source in your workspace, so when new web events are generated, they’ll be sent directly to that Data Source in your Workspace.
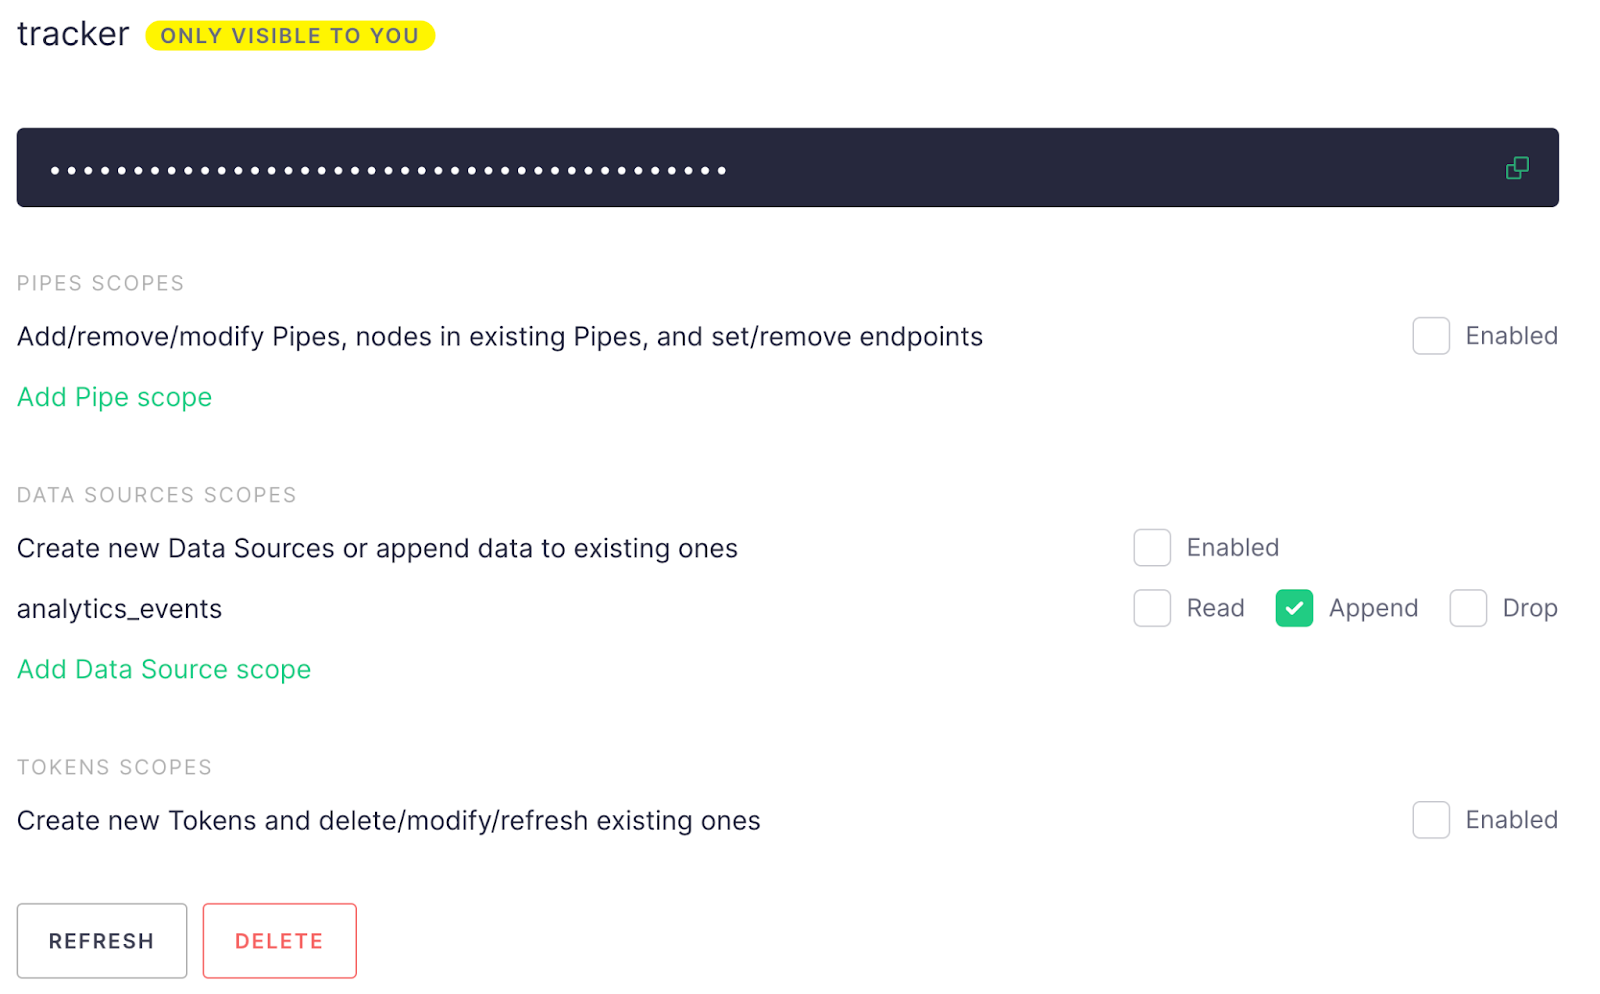
To see and manage your tokens and their permissions, navigate to “Manage Auth Tokens” in the left nav of the Tinybird UI.
Step 3: Navigate to your readymade analytics dashboard!
The Tinybird Web Analytics Starter Kit includes an analytics dashboard with some basic views straight out of the box. Once you’ve installed the tracking snippet on your website, all you need to do is navigate to the dashboard URL. Here’s how.
If you’ve successfully added the snippet to your page and generated some traffic events into your analytics_events Data Source, you’ll see the banner below in the Tinybird UI (you may need to refresh your browser).

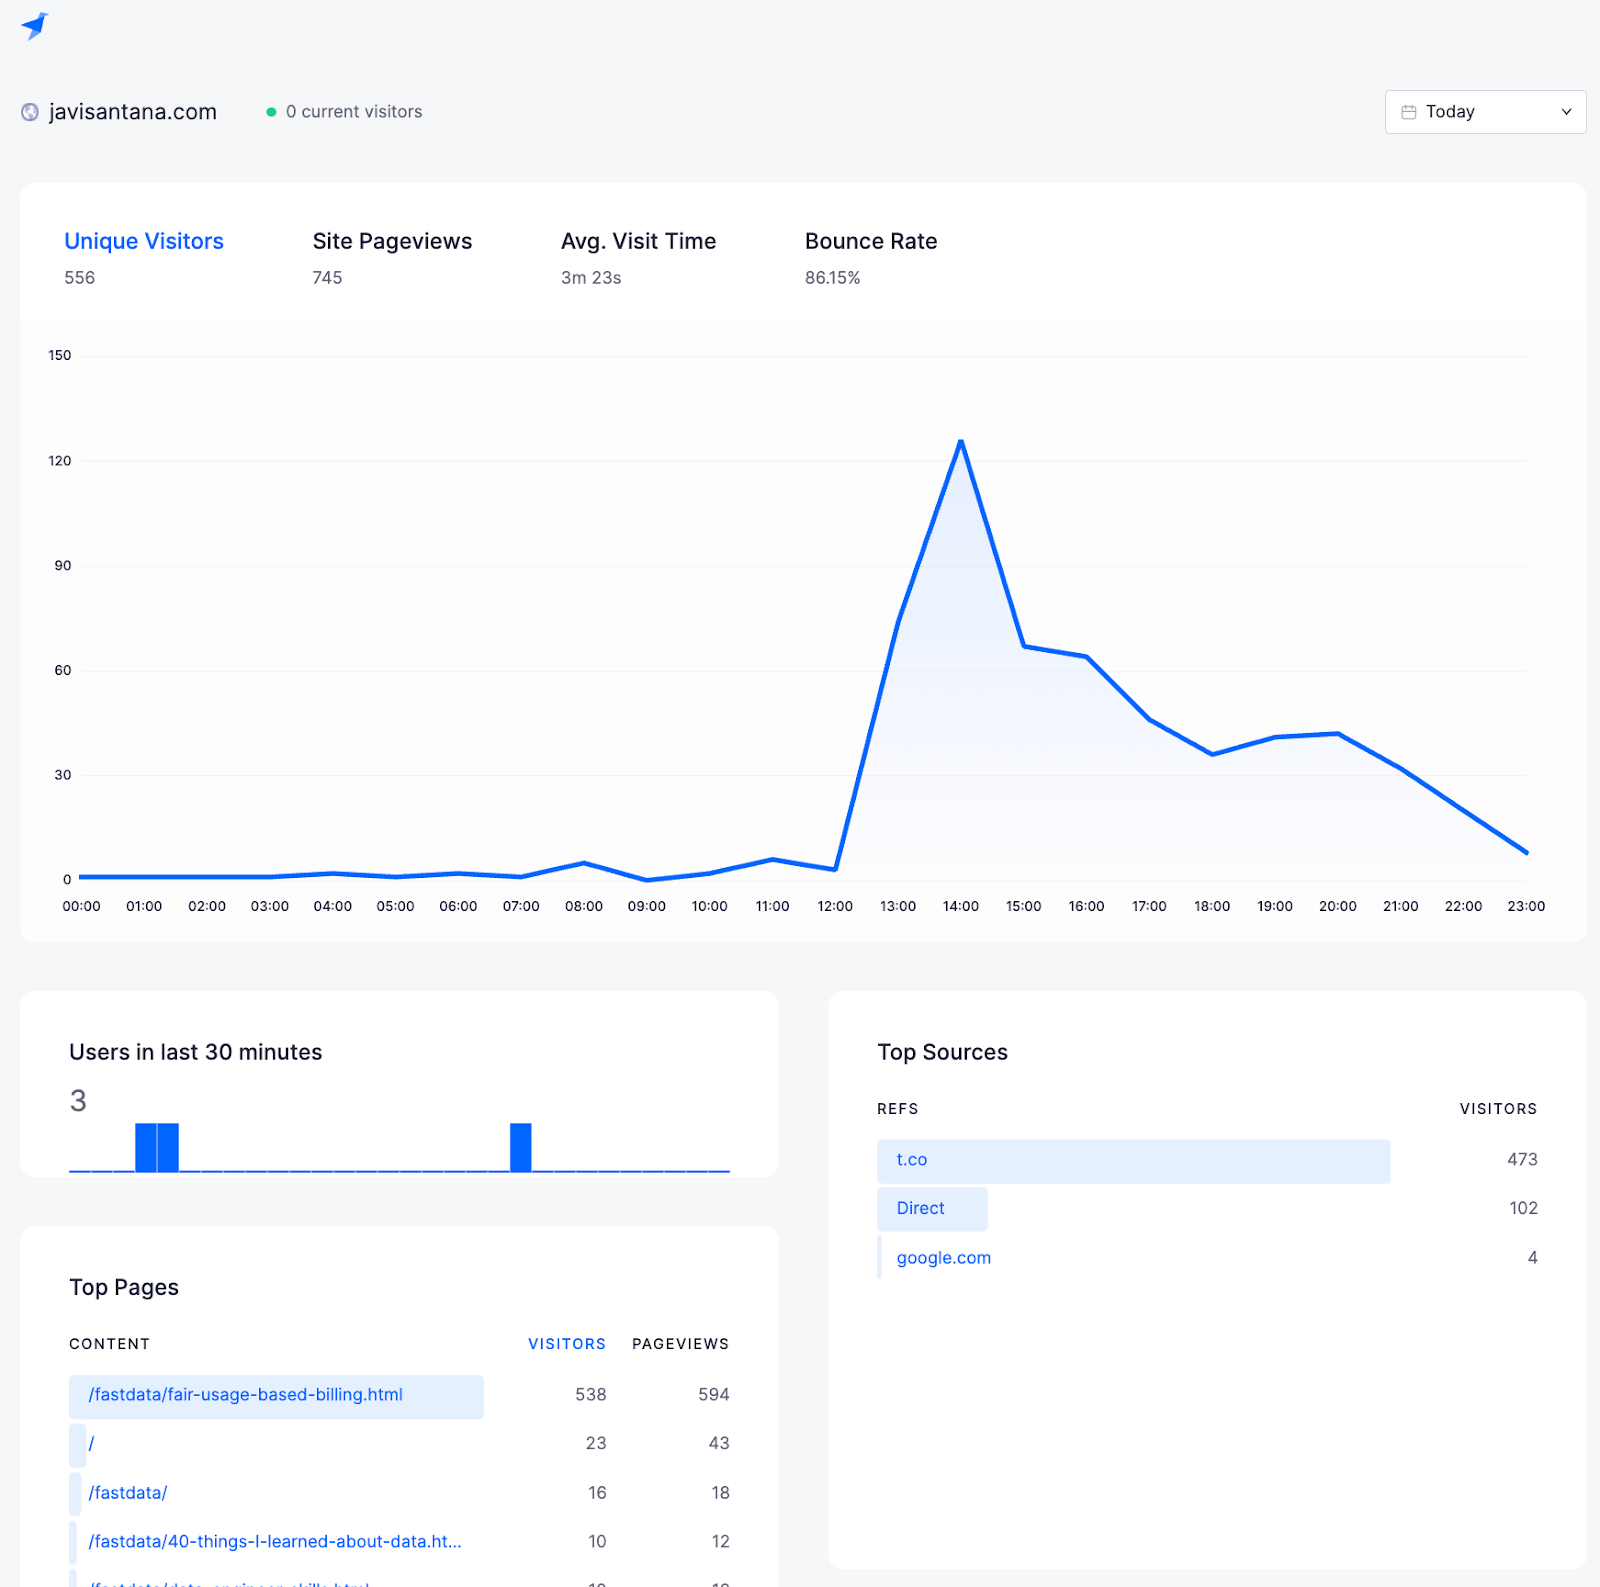
Click “View dashboard”, or if you aren’t in the Tinybird UI, just go to analytics.tinybird.co, enter your dashboard token (which can be found under Manage Auth Tokens, the same place you saw your tracker token in Step 2), and select the host that matches the Tinybird region you chose in Step 1.
Boom! A readymade analytics dashboard with (hopefully) session metrics already populated.
What’s happening under the hood?
This blog post was written to get you up and running with a basic Google Analytics alternative in just a few minutes. But if you’re taking the DIY approach, then I’ll assume you’re not satisfied with just a basic dashboard; you probably want to create custom event types and your own analytics views.
In just a bit, I’ll explain how to do some of those customizations, but first, let’s take a peek under the hood of this Workspace to better understand how these analytics are generated.
The Data Flow
In the Tinybird UI, you can view the flow of data from Data Source to Endpoint. Here’s the data flow for this Starter Kit out of the box:

Pageview events generated by the tracker are sent to the analytics_events Data Source using the Tinybird Events API (an ingestion endpoint that lets you send data to a Tinybird Data Source directly from an application using just an HTTP request).
When a new row (a single pageview event) hits the analytics_events Data Source, it’s processed through the analytics_hits Pipe, which parses the JSON payload for the event. The final node in the analytics_hits Pipe is published as a REST API.
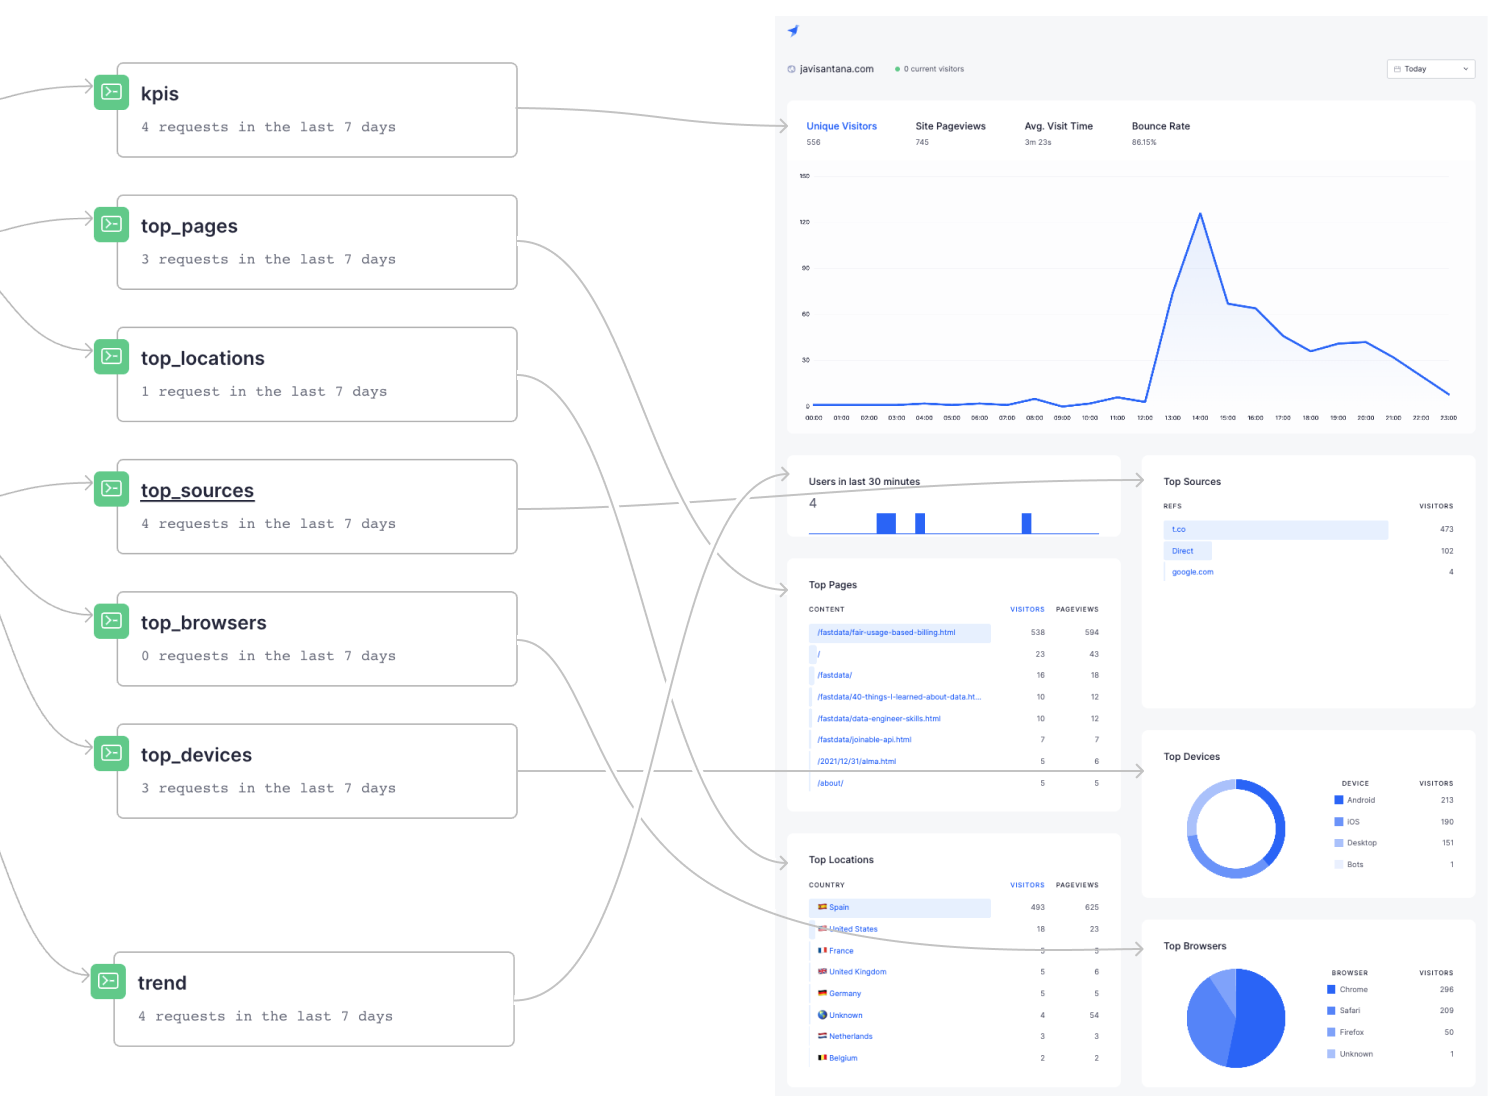
Four additional Pipes flow from the analytics_hits API Endpoint. One of these Pipes, trend, is published as an API Endpoint that feeds the “Users in last 30 minutes” widget in the analytics dashboard.
The other three (analytics_sessions, analytics_pages, and analytics_sources) materialize data into Materialized View Data Sources, which store incrementally updated aggregations and can be used to improve endpoint performance by shifting aggregation compute to ingestion time instead of query time.
In this case, these Pipes materialize aggregations on session metrics, pages, and traffic sources.
The last six Pipes are published as API Endpoints that feed the remaining widgets on the dashboard. The graphic below shows you which Endpoints in the Tinybird Data Flow support the widgets on the dashboard:
Now that you understand the basic flow of data, let’s customize this bad boy.
Step 4: Customize the analytics dashboard
There are essentially three ways to customize your analytics:
- Define custom event types
- Create new metrics endpoints in Tinybird
- Create new dashboard widgets
I’ll show you basic examples of how to do each.
Define custom events
The JavaScript tracker that you installed on your website comes with a bundled function to track your own custom events. You can simply add this function at any point in your application. Here’s an example snippet of code you could add for an “Add to Cart” event:
You might, for example, add this code into the function that gets called by an event listener for your page’s “Add to Cart” button.
If you wanted to track eCommerce conversion funnels, you might also add events for starting checkout and completing the purchase, for example:
These new events will be logged in the analytics_events Data Source in Tinybird. You’ll see the event type show up in the payload column. You can use these custom events to create new metrics in a Tinybird Pipe.
Create new metrics with Tinybird Pipes
If you want to start tracking new metrics based on your new events or just pageviews, you can easily create them with a new Tinybird Pipe.
There are two ways to create Pipes in the Tinybird UI. If you want to start from scratch, just click the "+" icon next to Pipes in the left nav to create an empty Pipe. If you want to duplicate an existing pipe, navigate to that Pipe, click the "..." icon next to the Pipe Name, and click "Duplicate".
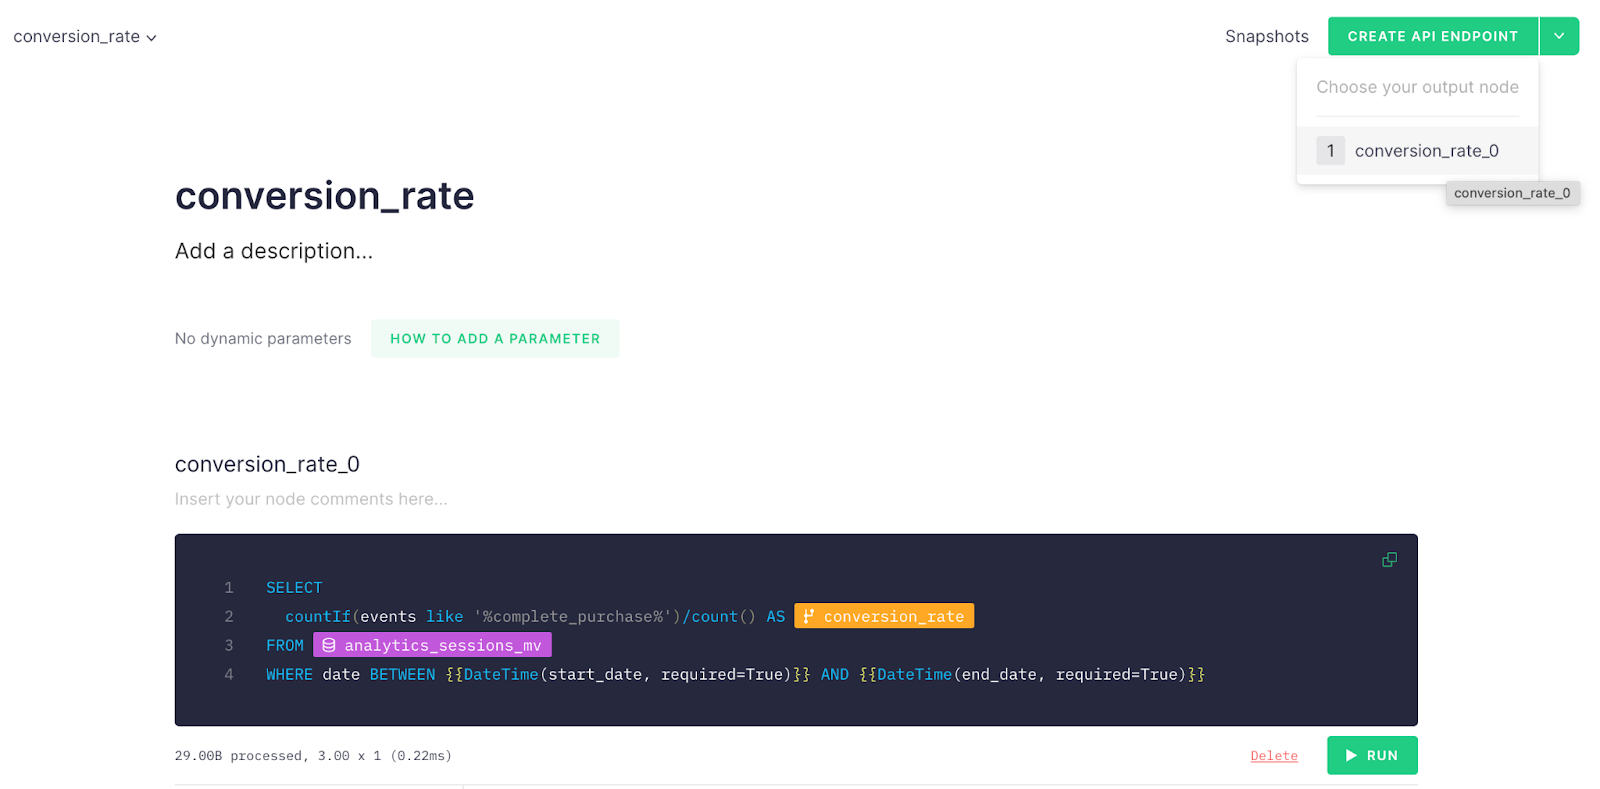
Here’s an example of a simple Tinybird Pipe that might select a count of sessions that contain a complete_purchase event (from the above example) divided by the total number of sessions to get a conversion rate (assuming you added to your analytics_sessions_mv Data Source a column called events containing a JSON payload (string) of all events during the session).
You could then publish this as a new API Endpoint in a single click by clicking “Create API Endpoint” and selecting the appropriate node.
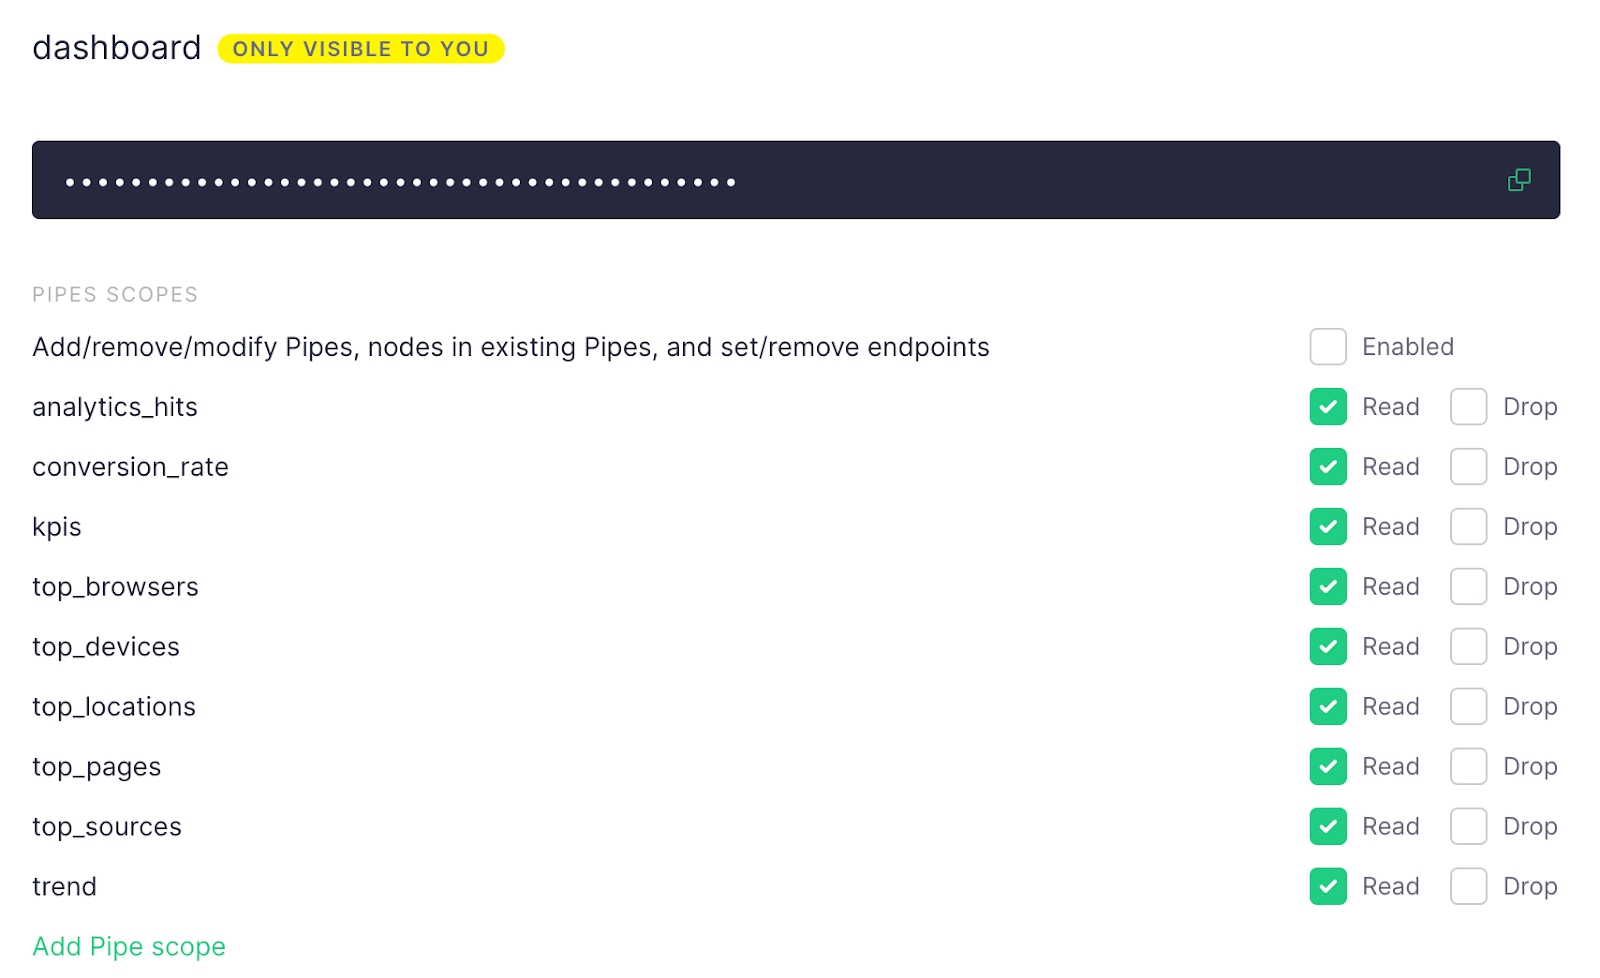
As a final step, make sure to add to the dashboard token a new Pipe scope to give read permission to the new Endpoints you’ve created.
Create new dashboard widgets
If you’ve created new metrics Endpoints, or you just want different visualizations, you’ll want to customize the standard dashboard. If you’re a frontend developer, this should be very simple.
The Starter Kit we’ve used in this blog post is based on an open source GitHub repository. Within that repository is a dashboard folder. All you need to do is fork the repository and augment the code for the dashboard to your liking. It’s built using Next.js with React v18 as a framework, and it uses Tailwind for CSS styling, so it’s very easy to customize if you’re comfortable with the tech stack.
If you have any questions about how to build your own custom widgets, or any of the steps in this post, hop into our Slack Community. We’re always happy to help!

