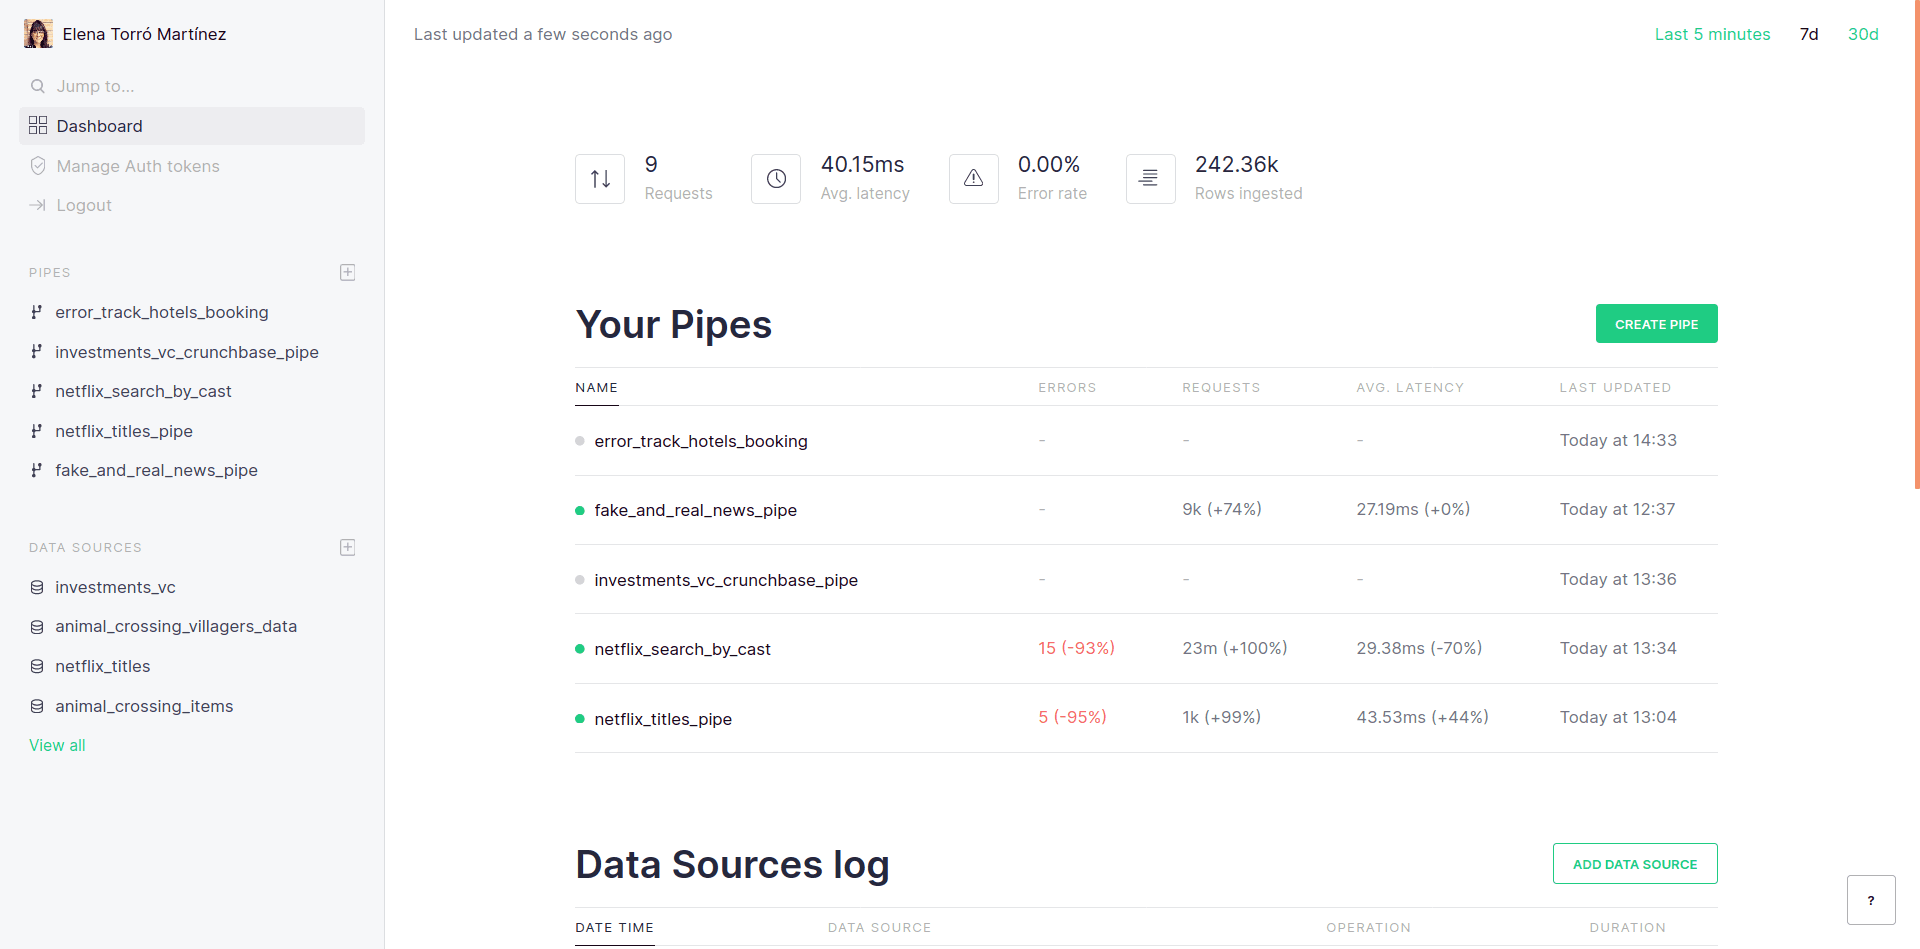
Tinybird is an analytics backend for software applications, and as LLM usage and AI features become more commonplace, developers are increasingly using Tinybird to track LLM usage, costs, and performance, both internally and in user-facing features.
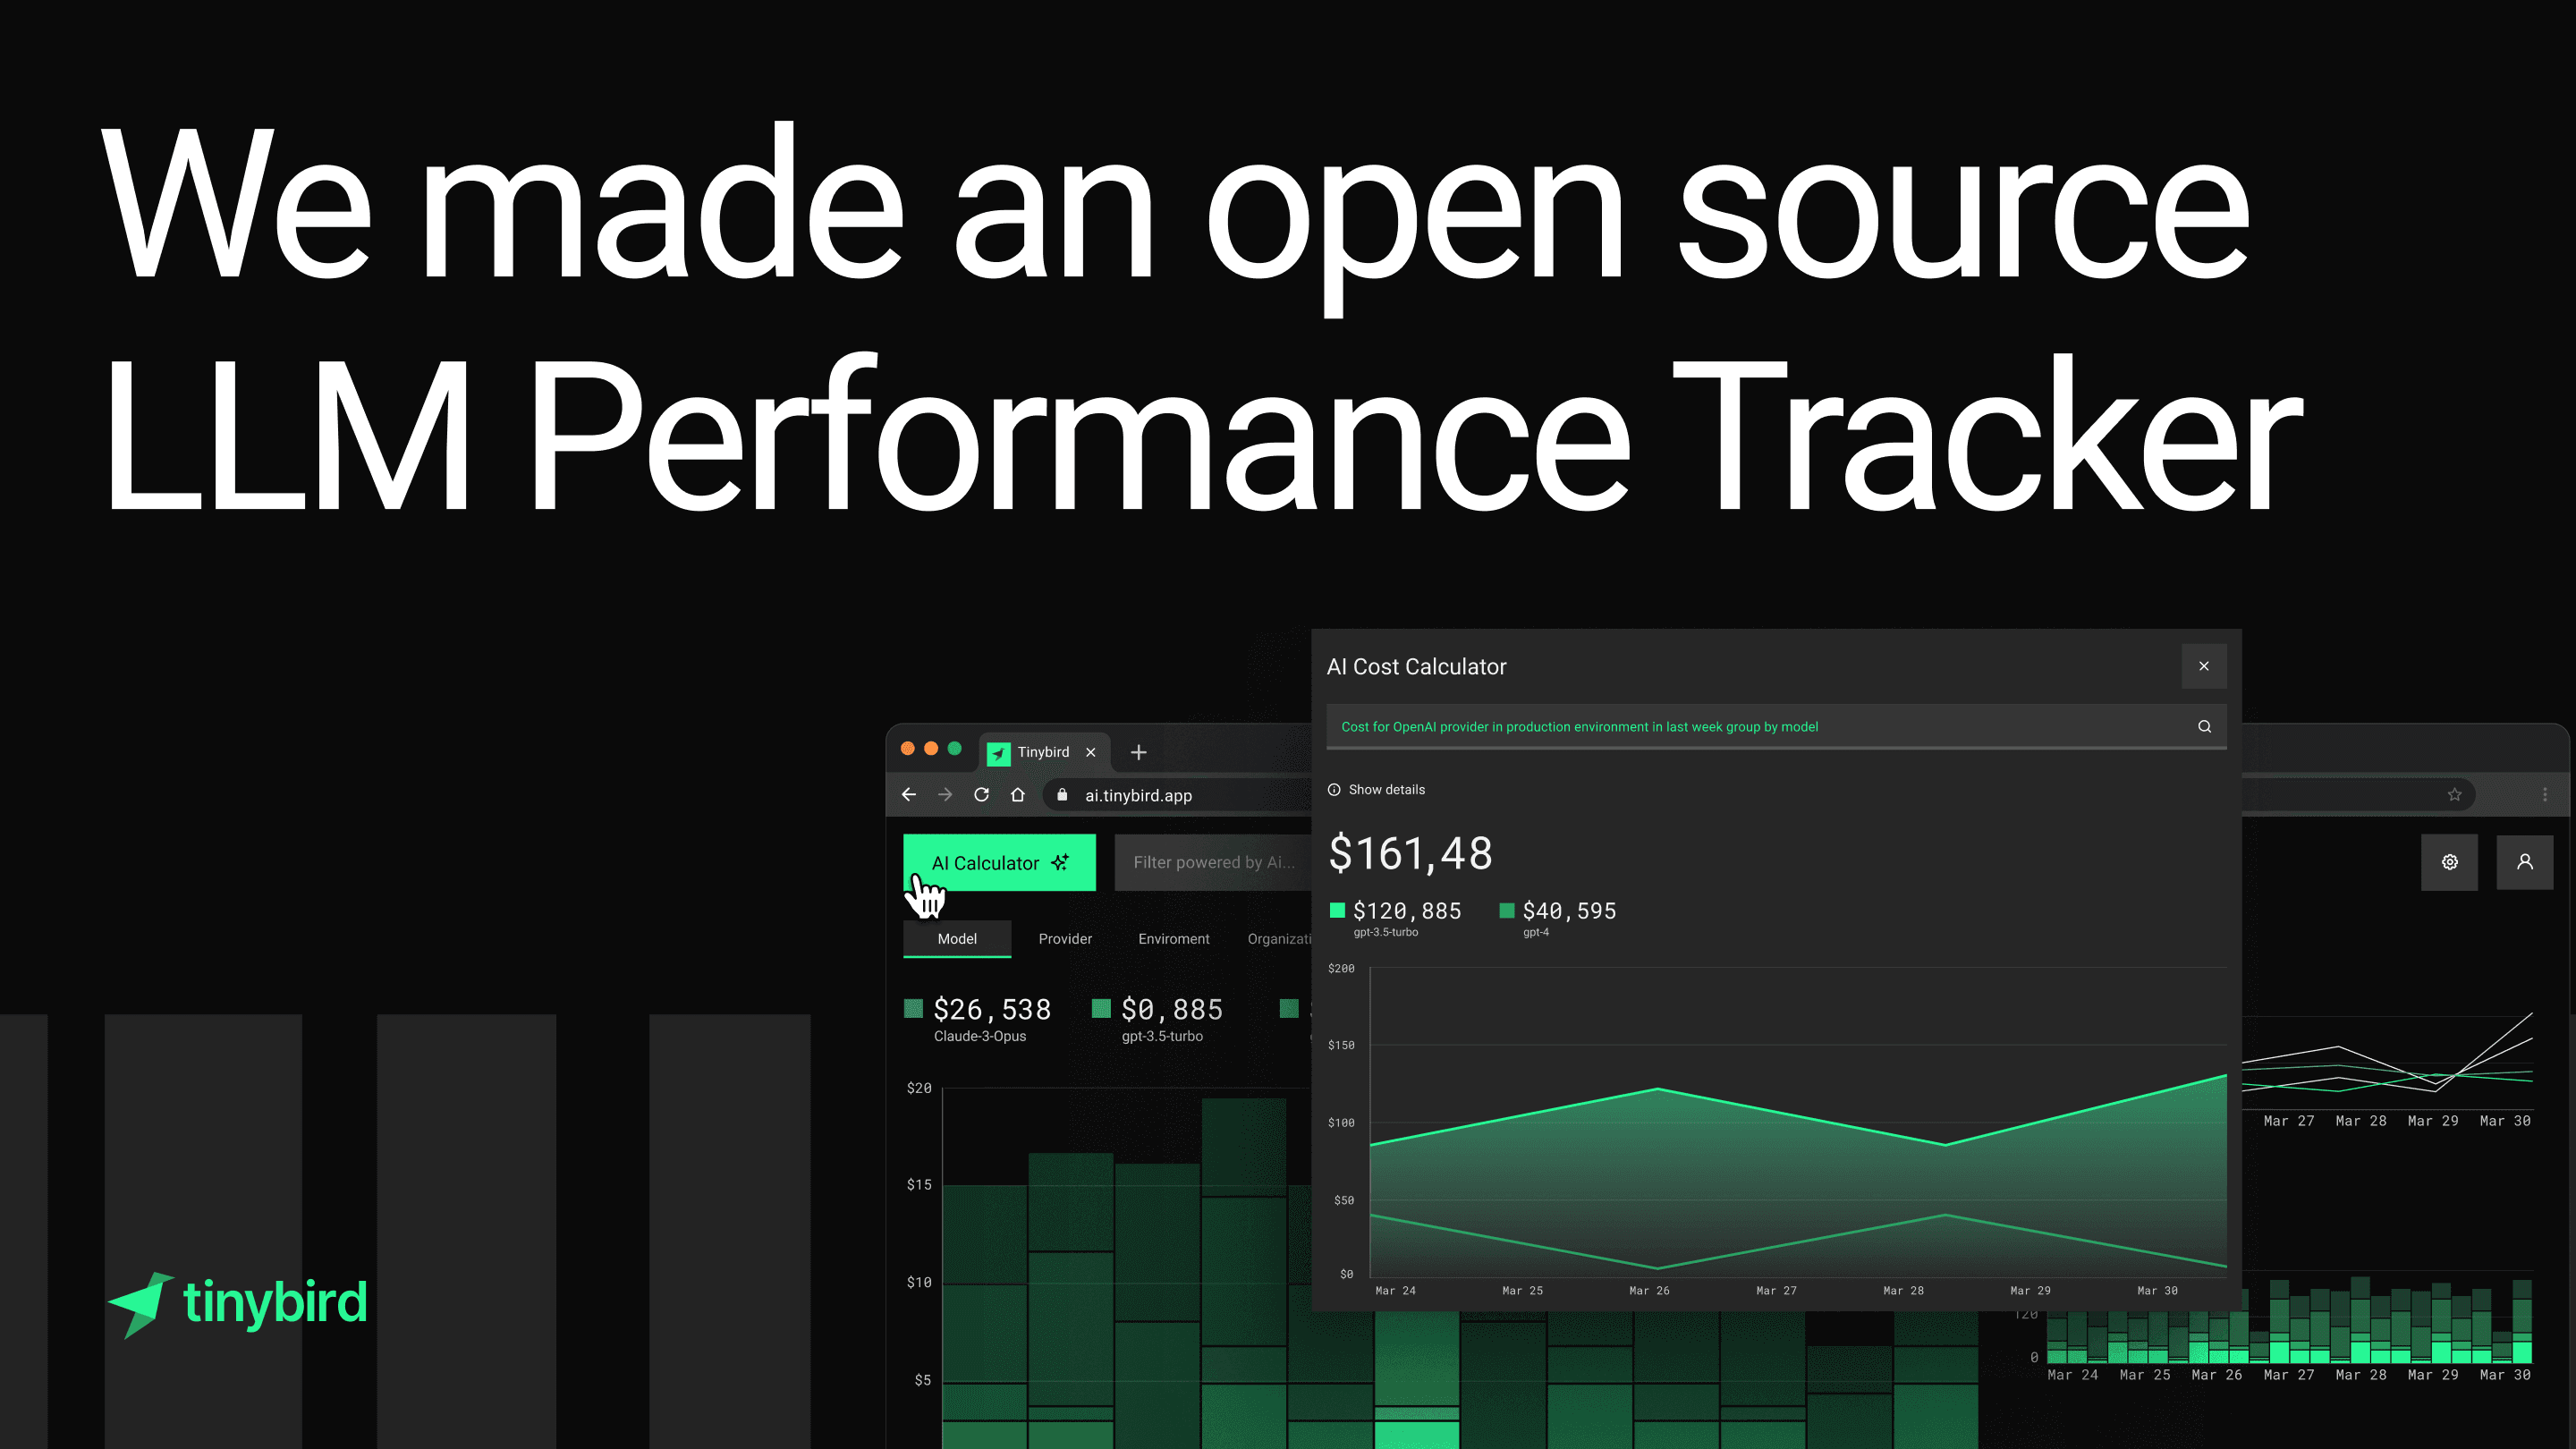
We recently open sourced an app template, the LLM Performance Tracker, that includes a frontend + backend to capture LLM calls from your AI apps and analyze your LLM usage in real time.
The template is full of cool features (kudos to my coworker @alrocar), but I want to focus on one in particular because I think it's going to be the new normal for real-time data visualization.
If you check out the live demo of the app, you'll notice a button in the top right corner: AI Cost Calculator.
Clicking this button opens a modal where you can define how you want to visualize your LLM costs. For example:
You can see it in action here:
A quick summary of what is happening under the hood:
- The user input is passed to an API
- The API uses an LLM to generate structured parameters for Tinybird data API
- The component determines what kind of chart to show by analyzing the user input
- The component fetches the Tinybird API with the LLM-supplied filters and hydrates the chart
Let me walk you through how we built this feature. If you're interested in building dynamic, user-generated data visualizations in your application, you can use this as inspiration.
By the way, all of the code snippets I share below are gleaned from the open source LLM Performance Tracker repo.
The components
There are 4 core components to this feature:
- A Tinybird datasource called
llm_events.datasource - A Tinybird pipe called
llm_usage.pipe - A React component called
CostPredictionModal.tsx - An
extract-cost-parametersAPI route
In addition, there are some utilities and services to simplify fetching the Tinybird APIs from the frontend.
Let's take a look at each of these components sequentially to understand how to create user-generated real-time data visualizations.
Storing and processing LLM calls with Tinybird
The basic primitives in Tinybird are data sources and pipes. Data sources store data, pipes transform it.
The llm_events data source in this project is designed to store time series data: LLM call events and all the metadata associated with the call.
Here's the table schema:
The llm_usage pipe defines a SQL query to select from the llm_events table. This pipe gets deployed as an API Endpoint, with query parameters defined using the Tinybird templating language:
A quick explanation of what is happening in this pipe definition:
- Aggregates LLM usage data (e.g. cost, tokens, requests, etc.) by date and, optionally, by a specified category (e.g. model)
- Is secured by a
read_pipestoken - Includes dynamic filtering for optionally supplied parameters like model, organization, project, environment, etc.
Once deployed (tb --cloud deploy), we can access this API via HTTP and supply parameters in the URL, for example:
This will return a JSON object with time series data containing all of the aggregate metrics grouped by model, filtered only on OpenAI calls.
This API is designed for scalability and speed, and should easily respond in milliseconds even as the number of LLM calls logged grows into the millions.
The time series chart in our dynamic UI fetches data from this API.
Defining an API route to generate structured parameters from user input
The extract-cost-parameters API route is the key piece of AI functionality. The LLM's job is to take the free-text user input, analyze it, and produce a set of structured parameters that can be passed to the Tinybird API.
To do that, it implements the following logic.
First, it fetches the pipe definition for the llm_usage pipe and the available dimensions (from another Tinybird API endpoint, llm_dimensions):
The available dimensions are used to define the system prompt for the LLM, so it knows which dimensions are available for filtering:
Then, the request is made to the LLM provider (in this case OpenAI using gpt-3.5-turbo model):
Note that we're using a wrapped model, which is how we instrument the Vercel AI SDK to send LLM call events to Tinybird for usage (so we're both using this app to analyze LLM calls, and also analyzing calls made from this AI app :mindblown:)
Finally, the backend does some type checking and applies defaults for missing parameters, returning the structured parameters in the API response:
Gathering user input and displaying the chart in the UI
The core UI component is CostPredictionModal.tsx, which handles receiving user input, getting structured parameters from the LLM, fetching data from Tinybird with the structured parameters, and defining the type of chart to use based on the query.
First, the component handles the user input:
On submit, it determines the type of query based on heuristics (this could easily be handled by an additional LLM for more complex use cases):
And determines what type of chart to use (AreaChart vs BarChart, multiple categories, etc.) based on this analysis:
It then passes the user input to the extract-cost-parameters API route and sets the parameters based on the response:
Once it receives the parameters, it parses and cleans those parameters, fetches the Tinybird API, and runs the calculateCosts() function with the result:
The calculateCosts() function is responsible for setting the React states for the data and categories. For example, to process non-grouped data:
Finally, the component renders the chart with the data/categories stored in state (using chart components from the Tremor charts library).
The result: A dynamic chart that matches user intent
This is a relatively simple implementation of a dynamic, user-generated data visualization. It uses heuristic analysis to define the type of chart to generate, but this could easily be outsourced to LLMs as well for a more flexible/dynamic implementation.
Here are the important takeaways:
- We can use LLMs to generate structured data snippets from free-text input.
- We need a performant analytics backend (e.g. Tinybird) to parse those structured data snippets and return the data we need to visualize in real time
- We can define the type of visualization to create heuristically (as we did here) or using LLMs.
This pattern opens up a bunch of possibilities to allow end users to generate their own data visualizations. All we must do is give LLMs contextual understanding of the underlying data to be able to create structured filters, aggregations, and groupings.
Discussion: Why not use LLMs for everything?
In this demo, we used the LLM to take a free-text user input and return structured parameters that we could pass to my real-time analytics API.
Things we didn't use LLMs for:
- Determining what type of chart to produce
- Generating a SQL query to fetch the data
Why didn't I use LLMs?
Well, for #1, we certainly could have. The use case was simple enough that it didn't seem necessary, but it could easily be augmented. You simply add something to the LLM system prompt and ask it to determine what kind of query it is, and add it to the structured response of the LLM output. Easy.
#2 is a little more nuanced. Yes, we could ask the LLM to generate the SQL for us, and then ask the LLM to generate the chart component based on the results of the SQL.
Here's why we used a dynamic API endpoint instead:
- Encapsulated logic and best practices. If we're repeatedly delivering the same kind of analysis, having a somewhat static endpoint (with dynamic parameters) can both simplify and improve performance. We can encapsulate good data engineering practices into our query, rather than relying on the LLM to produce something good.
- Authentication, security, and multi-tenancy. Instructing an LLM to query a raw table of multi-tenant data carries a significant security risk. What if the wrong customer's data gets exposed? We could isolate each customer's data into a separate table, but that isn't always feasible. Using an API secured by tokens/JWTs guarantees security and data privacy in multi-tenant architectures.
- Rate limiting. Related to the above. We can add rate limits to user tokens for the API to ensure it isn't abused.
- Better observability. If LLMs are generating SQL queries willy nilly, it becomes much more challenging to monitor performance and debug. While LLM observability is getting better, this scenario would add a lot of complexity we don't want to deal with.
- More deterministic output and resource usage. LLMs are great. But they do not supply deterministic responses with deterministic resource usage. As a SaaS/product builder, I would be wary of outsourcing too much functionality to LLMs, especially that which can use considerable compute resources.
LLMs will get better and better at writing good SQL. For now, we're sticking with tried-and-true APIs that give us speed, simplicity, and predictability in our analysis.
Get started
If you want to see the full implementation of this feature, check out the components mentioned in the LLM Performance Tracker repo.
If you're new to Tinybird, you can sign up for free (no time limit) and create real-time LLM analysis API endpoints in a few minutes using the template: